235 Main St Keyport, NJ 07735
Estimated Value: $558,000 - $662,000
2
Beds
2
Baths
1,756
Sq Ft
$348/Sq Ft
Est. Value
About This Home
This home is located at 235 Main St, Keyport, NJ 07735 and is currently estimated at $610,964, approximately $347 per square foot. 235 Main St is a home located in Monmouth County with nearby schools including Keyport Central School, Keyport High School, and Icob Academy.
Ownership History
Date
Name
Owned For
Owner Type
Purchase Details
Closed on
Feb 11, 2019
Sold by
Locke Mantin H
Bought by
Lorke Martyn and Lorke Joann
Current Estimated Value
Purchase Details
Closed on
Aug 26, 2010
Sold by
Sonatore Ann K
Bought by
Locke Marty
Home Financials for this Owner
Home Financials are based on the most recent Mortgage that was taken out on this home.
Original Mortgage
$165,000
Interest Rate
4.48%
Mortgage Type
New Conventional
Purchase Details
Closed on
Apr 20, 2002
Sold by
Jimenez Leah
Bought by
Bracchi John
Home Financials for this Owner
Home Financials are based on the most recent Mortgage that was taken out on this home.
Original Mortgage
$156,500
Interest Rate
6.82%
Mortgage Type
FHA
Purchase Details
Closed on
Jul 14, 1994
Sold by
Straub Rosemary
Bought by
Sonatore Ann
Create a Home Valuation Report for This Property
The Home Valuation Report is an in-depth analysis detailing your home's value as well as a comparison with similar homes in the area
Home Values in the Area
Average Home Value in this Area
Purchase History
| Date | Buyer | Sale Price | Title Company |
|---|---|---|---|
| Lorke Martyn | -- | None Available | |
| Locke Marty | $320,000 | Old Republic National Title | |
| Bracchi John | $159,000 | -- | |
| Sonatore Ann | $110,000 | -- |
Source: Public Records
Mortgage History
| Date | Status | Borrower | Loan Amount |
|---|---|---|---|
| Previous Owner | Locke Marty | $165,000 | |
| Previous Owner | Bracchi John | $156,500 |
Source: Public Records
Tax History
| Year | Tax Paid | Tax Assessment Tax Assessment Total Assessment is a certain percentage of the fair market value that is determined by local assessors to be the total taxable value of land and additions on the property. | Land | Improvement |
|---|---|---|---|---|
| 2025 | $12,660 | $645,900 | $216,100 | $429,800 |
| 2024 | $12,177 | $611,600 | $202,900 | $408,700 |
Source: Public Records
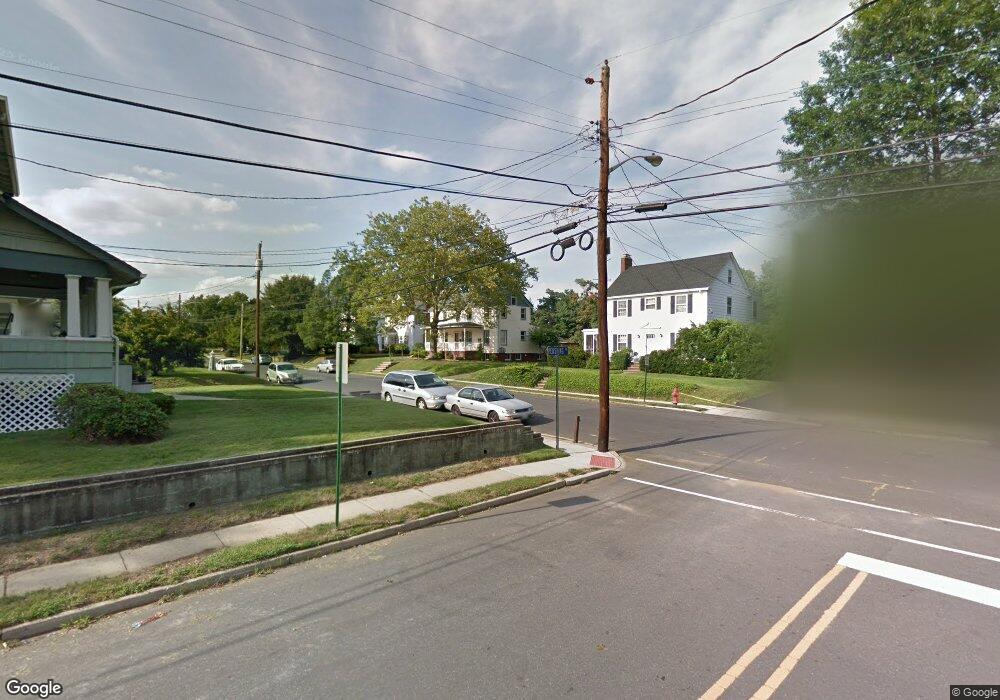
Map
Nearby Homes
- 9 Hurley St
- 231 Atlantic St Unit 23
- 231 Atlantic St Unit 83
- 226 Osborn St
- 6 Octavia Place
- 104 Church St
- 9 Kearney St Unit A
- 87 Church St
- 155 Luppatatong Ave
- 72 Manchester Ave
- 75 Broad St
- 74 Manchester Ave
- 40 Church St
- 55 E Front St
- 2 Chingarora Ave
- 2108 Florence Ave
- 95 Broadway
- 253 Broadway
- 55 1st St Unit 2
- 162 2nd St
Your Personal Tour Guide
Ask me questions while you tour the home.