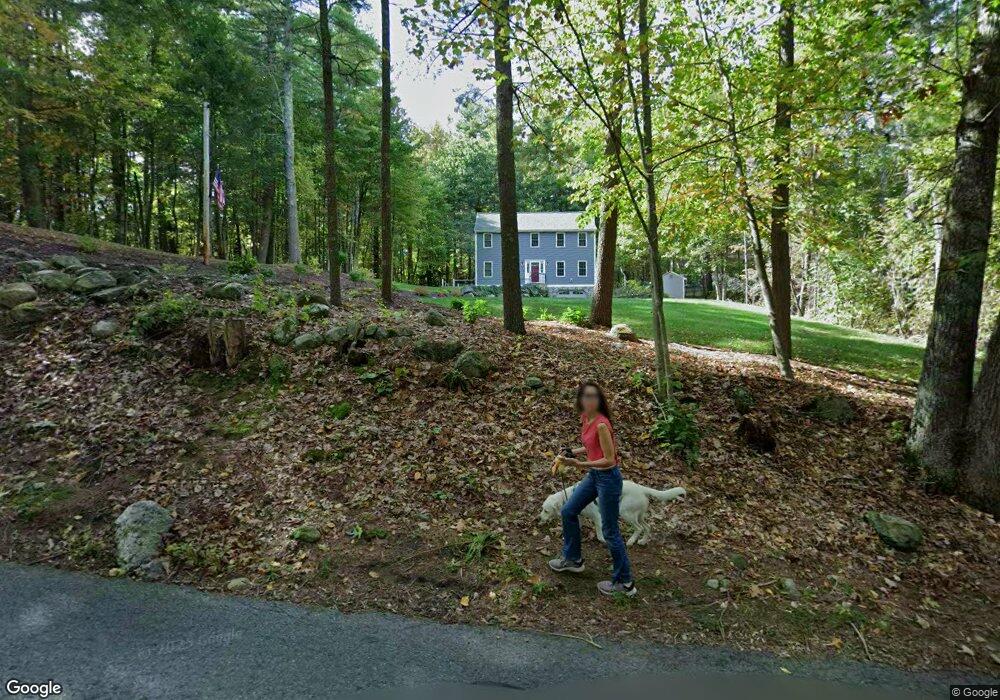
235 Mason Rd Jefferson, MA 01522
Estimated Value: $516,000 - $605,000
3
Beds
2
Baths
1,791
Sq Ft
$312/Sq Ft
Est. Value
About This Home
This home is located at 235 Mason Rd, Jefferson, MA 01522 and is currently estimated at $558,025, approximately $311 per square foot. 235 Mason Rd is a home located in Worcester County with nearby schools including Wachusett Regional High School.
Ownership History
Date
Name
Owned For
Owner Type
Purchase Details
Closed on
Sep 30, 2005
Sold by
Enman Maureen G and Oneill Maureen G
Bought by
Simko Gregory J
Current Estimated Value
Home Financials for this Owner
Home Financials are based on the most recent Mortgage that was taken out on this home.
Original Mortgage
$266,400
Outstanding Balance
$143,308
Interest Rate
5.84%
Mortgage Type
Purchase Money Mortgage
Estimated Equity
$414,717
Create a Home Valuation Report for This Property
The Home Valuation Report is an in-depth analysis detailing your home's value as well as a comparison with similar homes in the area
Home Values in the Area
Average Home Value in this Area
Purchase History
| Date | Buyer | Sale Price | Title Company |
|---|---|---|---|
| Simko Gregory J | $333,000 | -- |
Source: Public Records
Mortgage History
| Date | Status | Borrower | Loan Amount |
|---|---|---|---|
| Open | Simko Gregory J | $266,400 |
Source: Public Records
Tax History
| Year | Tax Paid | Tax Assessment Tax Assessment Total Assessment is a certain percentage of the fair market value that is determined by local assessors to be the total taxable value of land and additions on the property. | Land | Improvement |
|---|---|---|---|---|
| 2025 | $6,528 | $471,000 | $184,500 | $286,500 |
| 2024 | $5,964 | $421,500 | $179,300 | $242,200 |
| 2023 | $5,627 | $375,400 | $155,700 | $219,700 |
| 2022 | $5,256 | $317,400 | $121,900 | $195,500 |
| 2021 | $0 | $304,700 | $116,100 | $188,600 |
| 2020 | $5,124 | $301,400 | $110,900 | $190,500 |
| 2019 | $5,034 | $288,500 | $110,900 | $177,600 |
| 2018 | $0 | $270,800 | $105,600 | $165,200 |
| 2017 | $4,723 | $268,500 | $105,600 | $162,900 |
| 2016 | $4,416 | $256,000 | $100,700 | $155,300 |
| 2015 | $4,503 | $248,500 | $100,700 | $147,800 |
| 2014 | $4,411 | $248,500 | $100,700 | $147,800 |
Source: Public Records
Map
Nearby Homes
- 376 Elmwood Ave
- 0 North St
- 9 Stagecoach Rd
- 287 Laurel St
- 30 Duxbury Dr
- 35 Laurel Hill Ln
- 64 Rivington Dr
- 129 Quinapoxet St
- 4 Deanna Dr
- 134 Jamieson Rd
- 40 Princeton St
- 81 Deanna Dr
- 56 Highland Ave
- 197 High St
- 100 Brooks Station Rd
- 16 N Main St
- 135 Highland Ave
- 136 Winthrop Ln
- 63 Walnut St
- 64 Kendall Rd
Your Personal Tour Guide
Ask me questions while you tour the home.