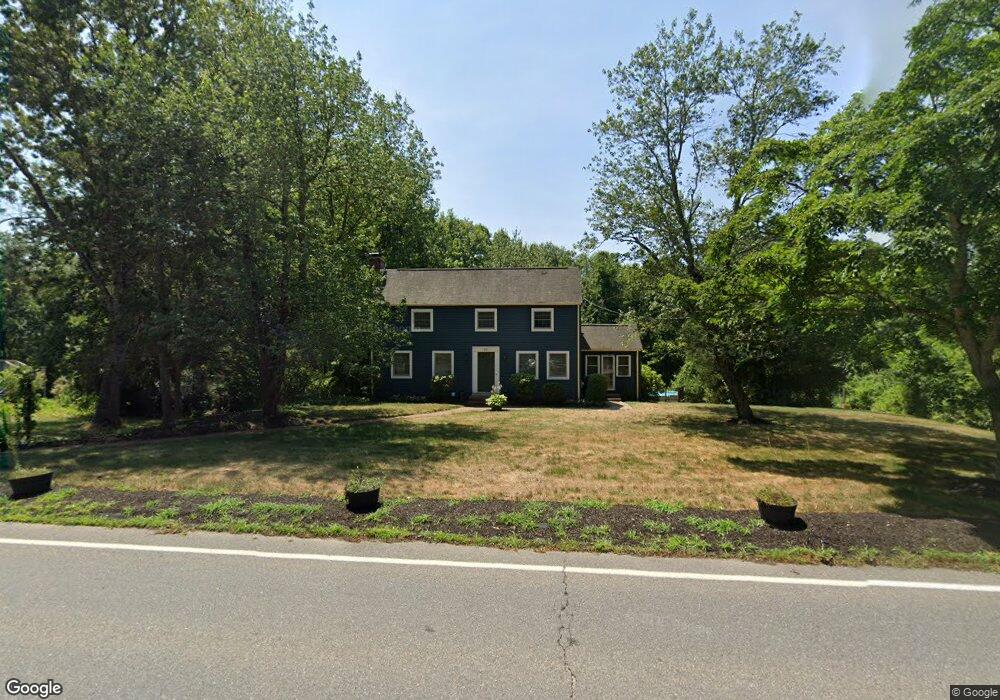
235 Maynard Rd Sudbury, MA 01776
Estimated Value: $865,526 - $1,024,000
3
Beds
2
Baths
1,872
Sq Ft
$513/Sq Ft
Est. Value
About This Home
This home is located at 235 Maynard Rd, Sudbury, MA 01776 and is currently estimated at $960,382, approximately $513 per square foot. 235 Maynard Rd is a home located in Middlesex County with nearby schools including General John Nixon Elementary School, Ephraim Curtis Middle School, and Lincoln-Sudbury Regional High School.
Ownership History
Date
Name
Owned For
Owner Type
Purchase Details
Closed on
Mar 13, 2008
Sold by
Houle Patrick John and Sutera Vincent Anthony
Bought by
Sutera Vincent Anthony
Current Estimated Value
Home Financials for this Owner
Home Financials are based on the most recent Mortgage that was taken out on this home.
Original Mortgage
$336,000
Interest Rate
5.72%
Mortgage Type
Purchase Money Mortgage
Purchase Details
Closed on
Jan 25, 2000
Sold by
Mathews Tomas G and Mathews Lori
Bought by
Sutera Vincent A and Houle Patrick J
Purchase Details
Closed on
Jul 29, 1991
Sold by
Debaggis Agostino
Bought by
Mathews Tomas G and Mathews Lori
Create a Home Valuation Report for This Property
The Home Valuation Report is an in-depth analysis detailing your home's value as well as a comparison with similar homes in the area
Home Values in the Area
Average Home Value in this Area
Purchase History
| Date | Buyer | Sale Price | Title Company |
|---|---|---|---|
| Sutera Vincent Anthony | -- | -- | |
| Sutera Vincent Anthony | -- | -- | |
| Sutera Vincent Anthony | -- | -- | |
| Sutera Vincent A | $310,000 | -- | |
| Mathews Tomas G | $209,000 | -- | |
| Mathews Tomas G | $209,000 | -- |
Source: Public Records
Mortgage History
| Date | Status | Borrower | Loan Amount |
|---|---|---|---|
| Open | Mathews Tomas G | $340,000 | |
| Closed | Sutera Vincent Anthony | $336,000 |
Source: Public Records
Tax History
| Year | Tax Paid | Tax Assessment Tax Assessment Total Assessment is a certain percentage of the fair market value that is determined by local assessors to be the total taxable value of land and additions on the property. | Land | Improvement |
|---|---|---|---|---|
| 2025 | $11,504 | $785,800 | $426,200 | $359,600 |
| 2024 | $11,095 | $759,400 | $413,800 | $345,600 |
| 2023 | $10,497 | $665,600 | $376,200 | $289,400 |
| 2022 | $10,406 | $576,500 | $345,400 | $231,100 |
| 2021 | $10,161 | $539,600 | $345,400 | $194,200 |
| 2020 | $9,956 | $539,600 | $345,400 | $194,200 |
| 2019 | $9,664 | $539,600 | $345,400 | $194,200 |
| 2018 | $9,447 | $526,900 | $349,400 | $177,500 |
| 2017 | $9,104 | $513,200 | $337,400 | $175,800 |
| 2016 | $8,818 | $495,400 | $324,600 | $170,800 |
| 2015 | $8,392 | $476,800 | $309,400 | $167,400 |
| 2014 | $8,342 | $462,700 | $298,600 | $164,100 |
Source: Public Records
Map
Nearby Homes
- 111 Willis Rd
- 55 Widow Rites Ln
- 45 Widow Rites Ln
- 11 October Rd
- 6 Canterbury Dr
- 355 Maynard Rd
- 45 Webster Cir
- 62 Churchill St
- 8 Twillingate Rd
- 30 Harness Ln
- 96 Mossman Rd
- 557 Dutton Rd Unit 2
- 41 Old Coach Rd
- 427 Concord Rd
- 48 Chanticleer Rd
- 11 Great Lake Dr
- 377 Willis Rd
- 25 Poplar St
- 15 Huckleberry Ln
- 30 Kendall Rd
Your Personal Tour Guide
Ask me questions while you tour the home.