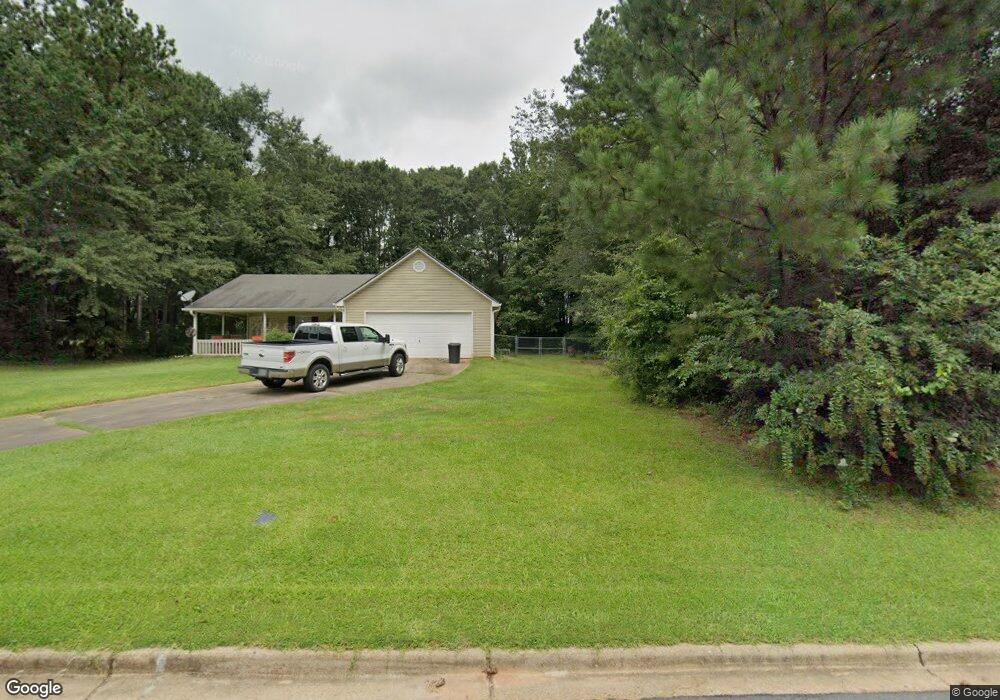
235 McGiboney Place Unit PLACE Covington, GA 30016
Estimated Value: $260,000 - $273,791
3
Beds
2
Baths
1,686
Sq Ft
$159/Sq Ft
Est. Value
About This Home
This home is located at 235 McGiboney Place Unit PLACE, Covington, GA 30016 and is currently estimated at $268,448, approximately $159 per square foot. 235 McGiboney Place Unit PLACE is a home located in Newton County with nearby schools including South Salem Elementary School, Liberty Middle School, and Newton High School.
Ownership History
Date
Name
Owned For
Owner Type
Purchase Details
Closed on
Sep 30, 2016
Sold by
Goliath Investments Llc
Bought by
Wilson Carolyn J
Current Estimated Value
Home Financials for this Owner
Home Financials are based on the most recent Mortgage that was taken out on this home.
Original Mortgage
$91,920
Outstanding Balance
$73,691
Interest Rate
3.46%
Mortgage Type
New Conventional
Estimated Equity
$194,757
Purchase Details
Closed on
Apr 8, 2015
Sold by
The Bank Of New York Mellon Trustee
Bought by
Secretary Of Housing And Urban Developme
Purchase Details
Closed on
Nov 30, 1999
Sold by
C Mitchell & Assoc
Bought by
Edens Thea V
Home Financials for this Owner
Home Financials are based on the most recent Mortgage that was taken out on this home.
Original Mortgage
$93,762
Interest Rate
7.94%
Mortgage Type
FHA
Create a Home Valuation Report for This Property
The Home Valuation Report is an in-depth analysis detailing your home's value as well as a comparison with similar homes in the area
Home Values in the Area
Average Home Value in this Area
Purchase History
| Date | Buyer | Sale Price | Title Company |
|---|---|---|---|
| Wilson Carolyn J | $114,900 | -- | |
| Secretary Of Housing And Urban Developme | -- | -- | |
| The Bank Of New York Mellon Tr | $125,617 | -- | |
| Edens Thea V | $92,000 | -- |
Source: Public Records
Mortgage History
| Date | Status | Borrower | Loan Amount |
|---|---|---|---|
| Open | Wilson Carolyn J | $91,920 | |
| Previous Owner | Edens Thea V | $93,762 |
Source: Public Records
Tax History Compared to Growth
Tax History
| Year | Tax Paid | Tax Assessment Tax Assessment Total Assessment is a certain percentage of the fair market value that is determined by local assessors to be the total taxable value of land and additions on the property. | Land | Improvement |
|---|---|---|---|---|
| 2024 | $1,775 | $111,640 | $15,200 | $96,440 |
| 2023 | $2,300 | $113,760 | $7,600 | $106,160 |
| 2022 | $1,445 | $82,280 | $5,200 | $77,080 |
| 2021 | $1,111 | $65,760 | $5,200 | $60,560 |
| 2020 | $1,021 | $59,600 | $5,200 | $54,400 |
| 2019 | $833 | $53,640 | $5,200 | $48,440 |
| 2018 | $634 | $47,680 | $5,200 | $42,480 |
| 2017 | $236 | $36,080 | $5,200 | $30,880 |
| 2016 | $1,148 | $33,440 | $4,000 | $29,440 |
| 2015 | $976 | $32,320 | $3,400 | $28,920 |
| 2014 | -- | $30,920 | $0 | $0 |
Source: Public Records
Map
Nearby Homes
- 235 McGiboney Place
- 235 McGiboney Place Unit 25
- 225 McGiboney Place
- 245 McGiboney Place Unit 2
- 230 McGiboney Place Unit 2
- 220 Fox Meadow Dr Unit 3
- 215 McGiboney Place
- 210 Fox Meadow Dr
- 250 McGiboney Place Unit 2
- 250 McGiboney Place Unit 1
- 265 McGiboney Place
- 0 Forray Dr Dr
- 200 Fox Meadow Dr
- 260 McGiboney Place
- 205 McGiboney Place
- 275 McGiboney Place
- 210 McGiboney Place
- 240 Fox Meadow Dr
- 190 Fox Meadow Dr Unit 3
- 270 McGiboney Place