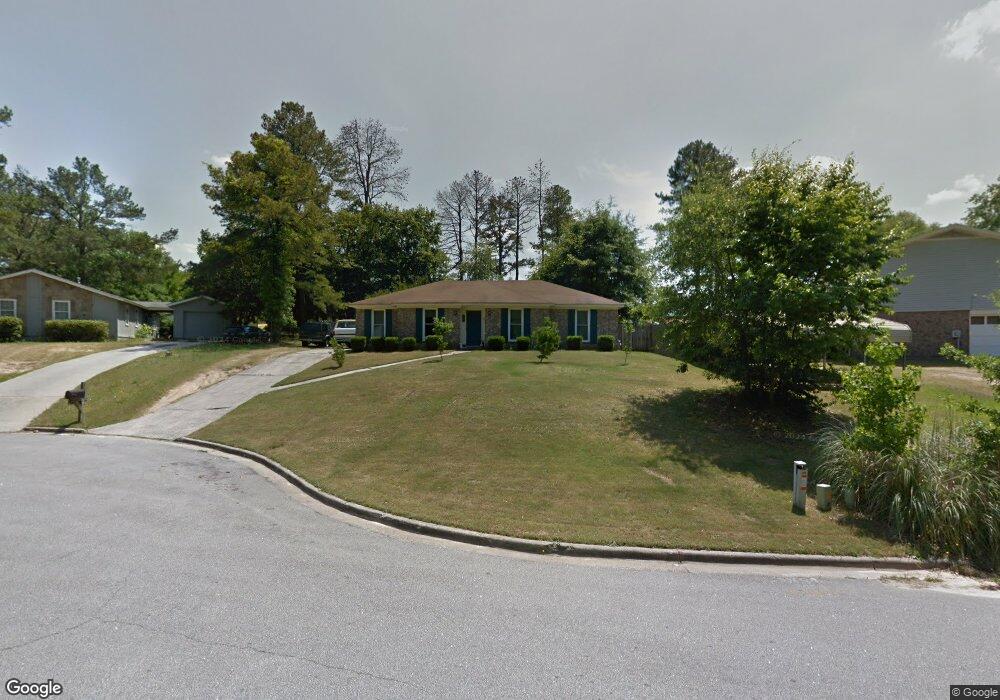
235 Monterey Ct Augusta, GA 30907
Estimated Value: $228,975 - $239,000
3
Beds
2
Baths
1,625
Sq Ft
$144/Sq Ft
Est. Value
About This Home
This home is located at 235 Monterey Ct, Augusta, GA 30907 and is currently estimated at $233,244, approximately $143 per square foot. 235 Monterey Ct is a home located in Columbia County with nearby schools including Westmont Elementary School, Columbia Middle School, and Jupiter High School.
Ownership History
Date
Name
Owned For
Owner Type
Purchase Details
Closed on
Sep 9, 2008
Sold by
Kelly Jason D
Bought by
Boyleston Peter K
Current Estimated Value
Home Financials for this Owner
Home Financials are based on the most recent Mortgage that was taken out on this home.
Original Mortgage
$106,067
Outstanding Balance
$70,159
Interest Rate
6.49%
Mortgage Type
FHA
Estimated Equity
$163,085
Purchase Details
Closed on
Apr 15, 2004
Sold by
Alexander Angela R
Bought by
Kelly Jason D
Home Financials for this Owner
Home Financials are based on the most recent Mortgage that was taken out on this home.
Original Mortgage
$104,652
Interest Rate
5.54%
Mortgage Type
VA
Purchase Details
Closed on
Aug 30, 2002
Sold by
Covington Ben Allen and Covington Helen D
Bought by
Alexander Angela R
Home Financials for this Owner
Home Financials are based on the most recent Mortgage that was taken out on this home.
Original Mortgage
$80,240
Interest Rate
6.31%
Mortgage Type
FHA
Create a Home Valuation Report for This Property
The Home Valuation Report is an in-depth analysis detailing your home's value as well as a comparison with similar homes in the area
Home Values in the Area
Average Home Value in this Area
Purchase History
| Date | Buyer | Sale Price | Title Company |
|---|---|---|---|
| Boyleston Peter K | $118,000 | -- | |
| Kelly Jason D | $102,400 | -- | |
| Alexander Angela R | $81,500 | -- |
Source: Public Records
Mortgage History
| Date | Status | Borrower | Loan Amount |
|---|---|---|---|
| Open | Boyleston Peter K | $106,067 | |
| Previous Owner | Kelly Jason D | $104,652 | |
| Previous Owner | Alexander Angela R | $80,240 |
Source: Public Records
Tax History Compared to Growth
Tax History
| Year | Tax Paid | Tax Assessment Tax Assessment Total Assessment is a certain percentage of the fair market value that is determined by local assessors to be the total taxable value of land and additions on the property. | Land | Improvement |
|---|---|---|---|---|
| 2025 | $2,011 | $83,802 | $17,904 | $65,898 |
| 2024 | $1,980 | $78,855 | $15,304 | $63,551 |
| 2023 | $1,980 | $76,844 | $15,304 | $61,540 |
| 2022 | $1,760 | $67,410 | $13,504 | $53,906 |
| 2021 | $1,800 | $65,977 | $13,004 | $52,973 |
| 2020 | $1,690 | $60,673 | $11,604 | $49,069 |
| 2019 | $1,564 | $56,154 | $10,404 | $45,750 |
| 2018 | $1,439 | $51,448 | $10,404 | $41,044 |
| 2017 | $1,288 | $45,853 | $9,404 | $36,449 |
| 2016 | $1,140 | $42,086 | $9,380 | $32,706 |
| 2015 | $1,082 | $39,861 | $9,380 | $30,481 |
| 2014 | $1,021 | $37,148 | $8,480 | $28,668 |
Source: Public Records
Map
Nearby Homes
- 340 Colonial Ct
- 221 Biltmore Dr
- 239 Cavalier Ct
- 606 Todd Rd
- 349 Westmont Dr
- 706 Muscadine Ct
- 319 Rockdale Rd
- 4507 Colonial Rd
- 1447 Collins Dr
- 2912 Palmetto Dr
- 4593 Millhaven Rd
- 2906 Palmetto Dr
- 230 Palmetto Dr
- 167 S Old Belair Rd
- 4573 Oakley Pirkle Rd
- 4577 Oakley Pirkle Rd
- 299 Ashbrook Dr
- 429 Wade Plantation Dr
- 302 Laurel Place
- 5171 Parnell Way
- 237 Biltmore Dr
- 233 Monterey Ct
- 4551 Colonial Rd
- 231 Monterey Ct
- 4551 Colonial Dr
- 239 Biltmore Dr
- 225 Monterey Ct
- 4547 Colonial Rd
- 229 Monterey Ct
- 223 Biltmore Dr
- 223 Biltmore Dr
- 227 Monterey Ct
- 220 Biltmore Dr
- 222 Biltmore Dr
- 4545 Colonial Rd
- 218 Biltmore Dr
- 344 Colonial Ct
- 224 Biltmore Dr
- 216 Biltmore Dr
- 4546 Colonial Rd Unit 12