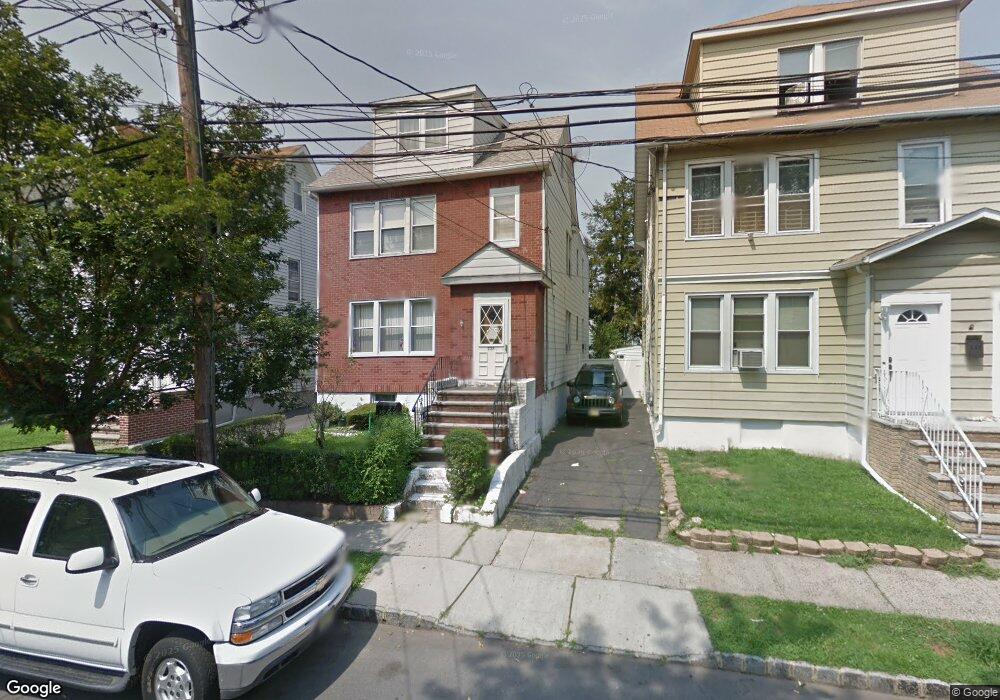
235 N 16th St Bloomfield, NJ 07003
Estimated Value: $558,829 - $760,000
--
Bed
--
Bath
2,592
Sq Ft
$259/Sq Ft
Est. Value
About This Home
This home is located at 235 N 16th St, Bloomfield, NJ 07003 and is currently estimated at $671,207, approximately $258 per square foot. 235 N 16th St is a home located in Essex County with nearby schools including Carteret School, Bloomfield Middle School, and Bloomfield High School.
Ownership History
Date
Name
Owned For
Owner Type
Purchase Details
Closed on
Jun 15, 2001
Sold by
Emperio Harriet
Bought by
Martinez Richard I
Current Estimated Value
Home Financials for this Owner
Home Financials are based on the most recent Mortgage that was taken out on this home.
Original Mortgage
$176,000
Outstanding Balance
$67,336
Interest Rate
7.2%
Estimated Equity
$603,871
Purchase Details
Closed on
Jan 3, 1995
Sold by
Emperio Nicholas
Bought by
Emperio Harriet
Purchase Details
Closed on
Dec 30, 1994
Sold by
Emperio Nicholas
Bought by
Emperio Harrit
Purchase Details
Closed on
Jun 6, 1991
Sold by
Emperio Harriet and Emperio Nicholas
Bought by
Emperio Harriet and Emperio Nicholas
Create a Home Valuation Report for This Property
The Home Valuation Report is an in-depth analysis detailing your home's value as well as a comparison with similar homes in the area
Home Values in the Area
Average Home Value in this Area
Purchase History
| Date | Buyer | Sale Price | Title Company |
|---|---|---|---|
| Martinez Richard I | $220,000 | -- | |
| Emperio Harriet | $20,000 | -- | |
| Emperio Harrit | $20,000 | -- | |
| Emperio Harriet | -- | -- |
Source: Public Records
Mortgage History
| Date | Status | Borrower | Loan Amount |
|---|---|---|---|
| Open | Martinez Richard I | $176,000 |
Source: Public Records
Tax History Compared to Growth
Tax History
| Year | Tax Paid | Tax Assessment Tax Assessment Total Assessment is a certain percentage of the fair market value that is determined by local assessors to be the total taxable value of land and additions on the property. | Land | Improvement |
|---|---|---|---|---|
| 2025 | $10,497 | $321,200 | $99,200 | $222,000 |
| 2024 | $10,497 | $321,200 | $99,200 | $222,000 |
| 2022 | $10,285 | $321,200 | $99,200 | $222,000 |
| 2021 | $10,095 | $321,200 | $99,200 | $222,000 |
| 2020 | $9,941 | $321,200 | $99,200 | $222,000 |
| 2019 | $10,514 | $264,100 | $98,000 | $166,100 |
| 2018 | $10,469 | $264,100 | $98,000 | $166,100 |
| 2017 | $10,310 | $264,100 | $98,000 | $166,100 |
| 2016 | $10,194 | $264,100 | $98,000 | $166,100 |
| 2015 | $10,102 | $264,100 | $98,000 | $166,100 |
| 2014 | $9,917 | $264,100 | $98,000 | $166,100 |
Source: Public Records
Map
Nearby Homes