


$99,900 Pending
- 3 Beds
- 1.5 Baths
- 1,292 Sq Ft
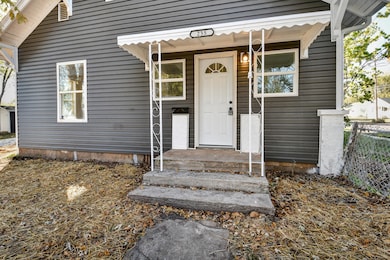
- 2723 W State St
- Springfield, MO
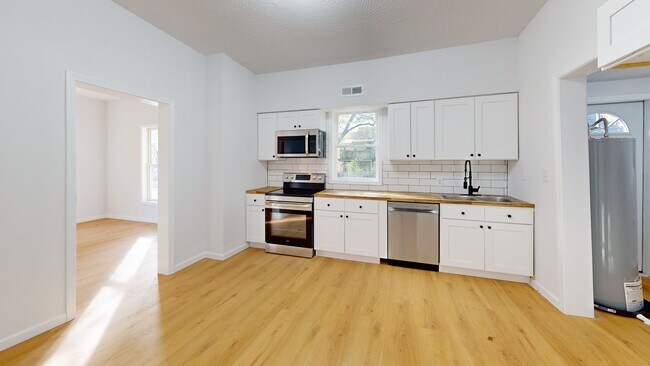
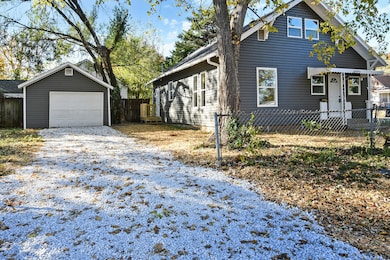
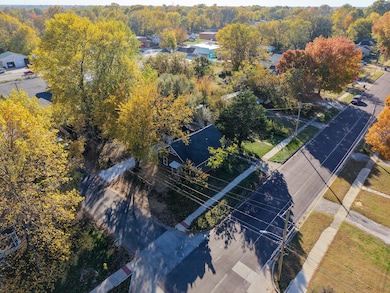
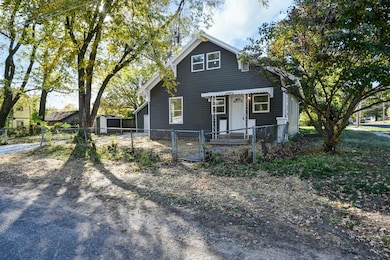
Roll up your sleeves and give this three-bed, one-bath home the refresh it deserves. A deep backyard, shady trees, and a detached garage/workshop set the stage outside, while two living areas and a brick fireplace offer solid bones inside. Perfect for investors or DIY-minded buyers ready to build quick equity.
William Smith Valiant Group Real Estate