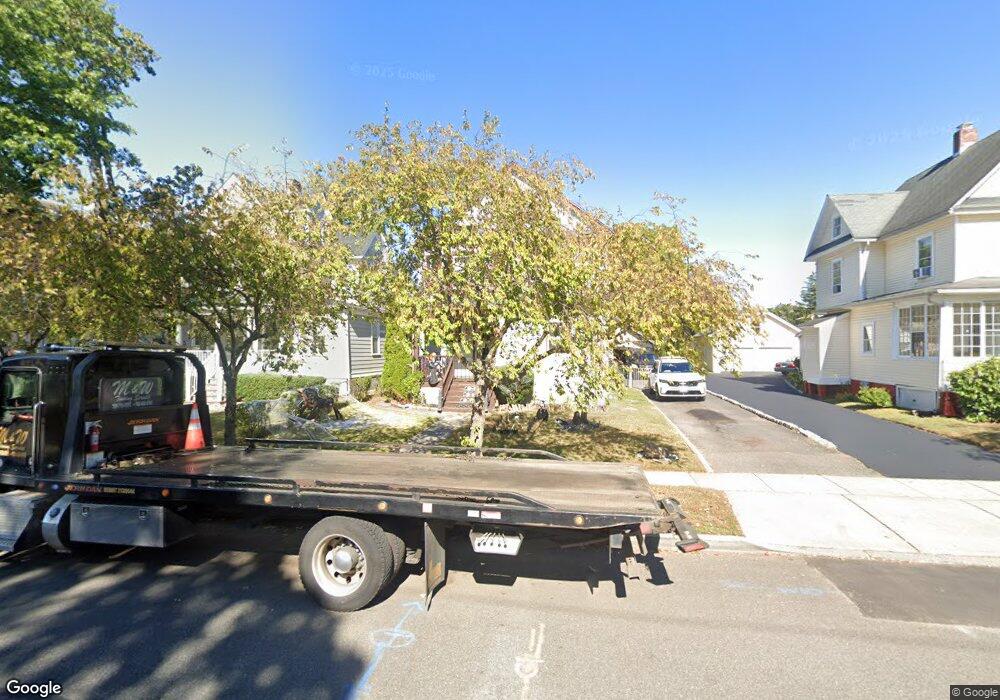
235 Netherwood Ave Unit 37 Plainfield, NJ 07062
Estimated Value: $433,431 - $567,000
3
Beds
2
Baths
1,586
Sq Ft
$316/Sq Ft
Est. Value
About This Home
This home is located at 235 Netherwood Ave Unit 37, Plainfield, NJ 07062 and is currently estimated at $500,608, approximately $315 per square foot. 235 Netherwood Ave Unit 37 is a home located in Union County with nearby schools including Emerson Community School, Maxson Middle School, and Plainfield High School.
Ownership History
Date
Name
Owned For
Owner Type
Purchase Details
Closed on
Sep 12, 2003
Sold by
Gutierrez Diana
Bought by
Guevara Fabian
Current Estimated Value
Home Financials for this Owner
Home Financials are based on the most recent Mortgage that was taken out on this home.
Original Mortgage
$224,200
Interest Rate
5.89%
Purchase Details
Closed on
Nov 27, 2002
Sold by
Farnell Travis
Bought by
Gutierrez Diana and American Luna +
Home Financials for this Owner
Home Financials are based on the most recent Mortgage that was taken out on this home.
Original Mortgage
$188,384
Interest Rate
6.17%
Mortgage Type
FHA
Purchase Details
Closed on
Oct 21, 1996
Sold by
Parillo John
Bought by
Farnell Travis and Giddings Deryck
Home Financials for this Owner
Home Financials are based on the most recent Mortgage that was taken out on this home.
Original Mortgage
$60,000
Interest Rate
8.1%
Create a Home Valuation Report for This Property
The Home Valuation Report is an in-depth analysis detailing your home's value as well as a comparison with similar homes in the area
Home Values in the Area
Average Home Value in this Area
Purchase History
| Date | Buyer | Sale Price | Title Company |
|---|---|---|---|
| Guevara Fabian | $236,000 | -- | |
| Gutierrez Diana | $189,900 | -- | |
| Farnell Travis | $80,000 | -- |
Source: Public Records
Mortgage History
| Date | Status | Borrower | Loan Amount |
|---|---|---|---|
| Previous Owner | Guevara Fabian | $224,200 | |
| Previous Owner | Gutierrez Diana | $188,384 | |
| Previous Owner | Farnell Travis | $60,000 |
Source: Public Records
Tax History Compared to Growth
Tax History
| Year | Tax Paid | Tax Assessment Tax Assessment Total Assessment is a certain percentage of the fair market value that is determined by local assessors to be the total taxable value of land and additions on the property. | Land | Improvement |
|---|---|---|---|---|
| 2025 | $7,684 | $88,000 | $35,700 | $52,300 |
| 2024 | $7,608 | $88,000 | $35,700 | $52,300 |
| 2023 | $7,608 | $88,000 | $35,700 | $52,300 |
| 2022 | $7,444 | $88,000 | $35,700 | $52,300 |
| 2021 | $7,379 | $88,000 | $35,700 | $52,300 |
| 2020 | $7,358 | $88,000 | $35,700 | $52,300 |
| 2019 | $7,358 | $88,000 | $35,700 | $52,300 |
| 2018 | $7,204 | $88,000 | $35,700 | $52,300 |
| 2017 | $7,028 | $88,000 | $35,700 | $52,300 |
| 2016 | $6,884 | $88,000 | $35,700 | $52,300 |
| 2015 | $6,681 | $88,000 | $35,700 | $52,300 |
| 2014 | -- | $88,000 | $35,700 | $52,300 |
Source: Public Records
Map
Nearby Homes
- 258 Netherwood Ave Unit 60
- 1123 E 3rd St Unit 25
- 213 Netherwood Ave Unit 15
- 1206 E 2nd St Unit 8
- 358-400 E 2nd St
- 343 Netherwood Ave Unit 45
- 153-55 Leland Ave
- 836 E 2nd St Unit 38
- 1107 North Ave Unit 11
- 1107-11 North Ave
- 823 E 3rd St Unit 25
- 225 Sumner Ave Unit 27
- 808 E 3rd St
- 125 Leland Ave Unit 27
- 949 E Front St
- 949 E Front St Unit A
- 959 E Front St Unit D
- 1255 Columbia Ave Unit 57
- 1003 E Front St Unit A
- 14-16 Netherwood Ave
- 239 Netherwood Ave Unit 41
- 239 Netherwood Ave Unit 2
- 231 Netherwood Ave Unit 33
- 231-33 Netherwood Ave
- 243 Netherwood Ave Unit 45
- 45 Netherwood Ave Unit 47
- 227 Netherwood Ave Unit 29
- 227-29 Netherwood Ave
- 1110 E 3rd St Unit 12
- 1113 Earle Place Unit 15
- 247 Netherwood Ave Unit 49
- 1114 E 3rd St Unit 16
- 1114-16 E 3rd St
- 828-34 E 3rd St
- 1118 E 3rd St
- 251 Netherwood Ave Unit 53
- 228 Netherwood Ave Unit 32
- 234 Netherwood Ave Unit 38
- 225 Netherwood Ave
- 240 Netherwood Ave Unit 46