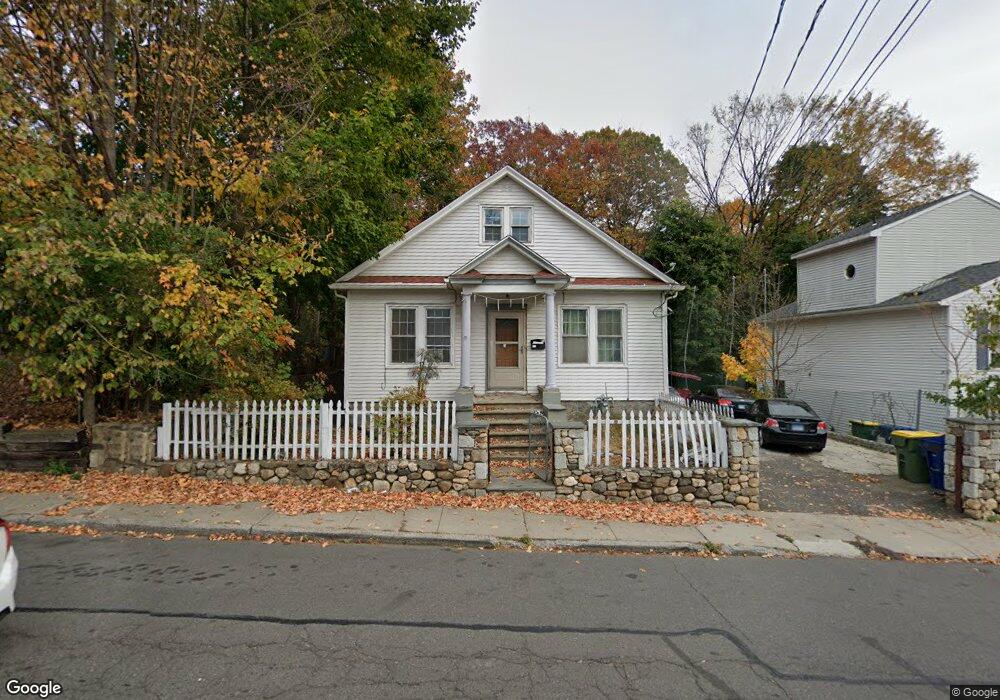
235 Oak St Waterbury, CT 06705
East End District NeighborhoodEstimated Value: $211,000 - $261,985
4
Beds
2
Baths
1,986
Sq Ft
$124/Sq Ft
Est. Value
About This Home
This home is located at 235 Oak St, Waterbury, CT 06705 and is currently estimated at $245,996, approximately $123 per square foot. 235 Oak St is a home located in New Haven County with nearby schools including Woodrow Wilson School, Michael F. Wallace Middle School, and Crosby High School.
Ownership History
Date
Name
Owned For
Owner Type
Purchase Details
Closed on
May 22, 2014
Sold by
Bravo-Deheras Nanci A
Bought by
Bravo Rosendo
Current Estimated Value
Purchase Details
Closed on
Oct 14, 2011
Sold by
Rodriguez Nancy
Bought by
Deheras Nanci and Azucena Bravo
Purchase Details
Closed on
Jul 1, 2002
Sold by
Margiotta Lovile Est and Margiotta
Bought by
Gugliotti Michael
Create a Home Valuation Report for This Property
The Home Valuation Report is an in-depth analysis detailing your home's value as well as a comparison with similar homes in the area
Home Values in the Area
Average Home Value in this Area
Purchase History
| Date | Buyer | Sale Price | Title Company |
|---|---|---|---|
| Bravo Rosendo | -- | -- | |
| Deheras Nanci | $45,500 | -- | |
| Gugliotti Michael | $68,000 | -- |
Source: Public Records
Mortgage History
| Date | Status | Borrower | Loan Amount |
|---|---|---|---|
| Previous Owner | Gugliotti Michael | $53,000 |
Source: Public Records
Tax History Compared to Growth
Tax History
| Year | Tax Paid | Tax Assessment Tax Assessment Total Assessment is a certain percentage of the fair market value that is determined by local assessors to be the total taxable value of land and additions on the property. | Land | Improvement |
|---|---|---|---|---|
| 2025 | $5,677 | $126,210 | $14,140 | $112,070 |
| 2024 | $6,240 | $126,210 | $14,140 | $112,070 |
| 2023 | $6,839 | $126,210 | $14,140 | $112,070 |
| 2022 | $4,366 | $72,510 | $14,160 | $58,350 |
| 2021 | $4,366 | $72,510 | $14,160 | $58,350 |
| 2020 | $4,366 | $72,510 | $14,160 | $58,350 |
| 2019 | $4,366 | $72,510 | $14,160 | $58,350 |
| 2018 | $4,272 | $70,950 | $12,600 | $58,350 |
| 2017 | $4,268 | $70,880 | $12,600 | $58,280 |
| 2016 | $4,268 | $70,880 | $12,600 | $58,280 |
| 2015 | $4,127 | $70,880 | $12,600 | $58,280 |
| 2014 | $4,127 | $70,880 | $12,600 | $58,280 |
Source: Public Records
Map
Nearby Homes