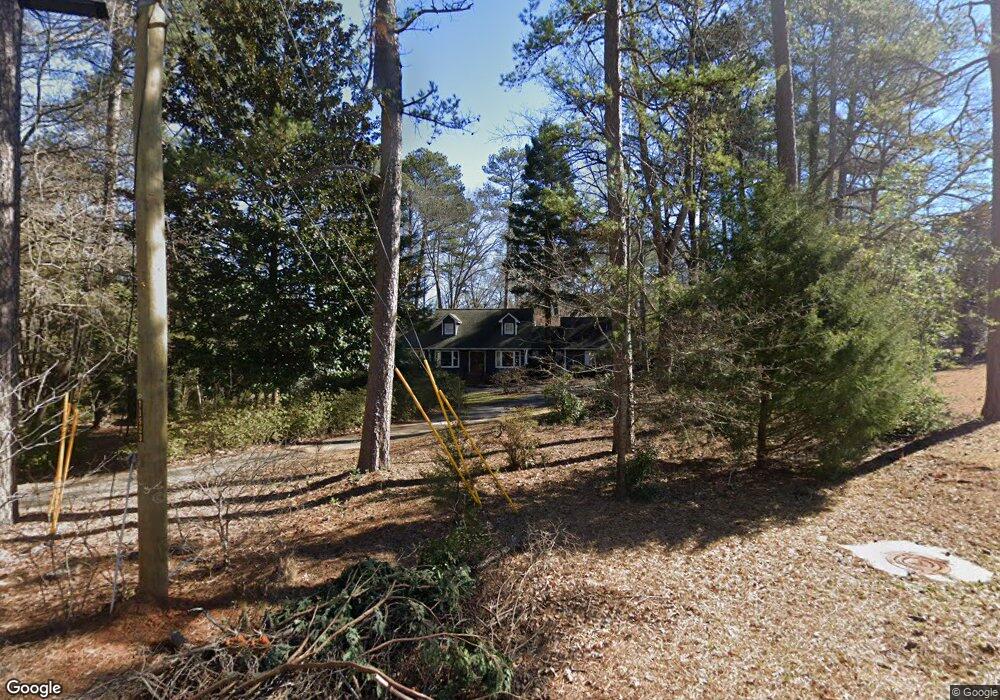
235 Pinewood Cir Athens, GA 30606
Skyline NeighborhoodEstimated Value: $652,907 - $759,000
--
Bed
1
Bath
3,892
Sq Ft
$182/Sq Ft
Est. Value
About This Home
This home is located at 235 Pinewood Cir, Athens, GA 30606 and is currently estimated at $708,227, approximately $181 per square foot. 235 Pinewood Cir is a home located in Clarke County with nearby schools including Timothy Elementary School, Clarke Middle School, and Clarke Central High School.
Ownership History
Date
Name
Owned For
Owner Type
Purchase Details
Closed on
Feb 1, 2024
Sold by
Butcher Andrew
Bought by
Butcher Family Living Trust Dated Novemb and Butcher Andrew Maxwell Tr
Current Estimated Value
Purchase Details
Closed on
May 28, 2021
Sold by
Costantino John
Bought by
Lowery Gene Vincent
Purchase Details
Closed on
Nov 24, 2020
Sold by
Yeatts Steven T
Bought by
Butcher Andrew
Home Financials for this Owner
Home Financials are based on the most recent Mortgage that was taken out on this home.
Original Mortgage
$386,650
Interest Rate
2.8%
Mortgage Type
New Conventional
Purchase Details
Closed on
Apr 13, 2012
Sold by
Yeatts Steven Terrell and Yeatts Carol
Bought by
Yeatts Steven T
Home Financials for this Owner
Home Financials are based on the most recent Mortgage that was taken out on this home.
Original Mortgage
$120,000
Interest Rate
3.96%
Mortgage Type
New Conventional
Purchase Details
Closed on
Dec 22, 2003
Sold by
Allen Nancy
Bought by
Yeatts Steven Terrell and Carol Seave
Create a Home Valuation Report for This Property
The Home Valuation Report is an in-depth analysis detailing your home's value as well as a comparison with similar homes in the area
Home Values in the Area
Average Home Value in this Area
Purchase History
| Date | Buyer | Sale Price | Title Company |
|---|---|---|---|
| Butcher Family Living Trust Dated Novemb | -- | -- | |
| Lowery Gene Vincent | -- | -- | |
| Butcher Andrew | $407,000 | -- | |
| Yeatts Steven T | -- | -- | |
| Yeatts Steven Terrell | $31,500 | -- |
Source: Public Records
Mortgage History
| Date | Status | Borrower | Loan Amount |
|---|---|---|---|
| Previous Owner | Butcher Andrew | $386,650 | |
| Previous Owner | Yeatts Steven T | $120,000 |
Source: Public Records
Tax History Compared to Growth
Tax History
| Year | Tax Paid | Tax Assessment Tax Assessment Total Assessment is a certain percentage of the fair market value that is determined by local assessors to be the total taxable value of land and additions on the property. | Land | Improvement |
|---|---|---|---|---|
| 2025 | $5,774 | $203,748 | $47,250 | $156,498 |
| 2024 | $5,774 | $198,990 | $47,250 | $151,740 |
| 2023 | $5,719 | $186,121 | $47,250 | $138,871 |
| 2022 | $4,850 | $162,032 | $37,800 | $124,232 |
| 2021 | $4,421 | $141,192 | $28,350 | $112,842 |
| 2020 | $3,812 | $123,124 | $28,350 | $94,774 |
| 2019 | $3,474 | $112,326 | $28,350 | $83,976 |
| 2018 | $3,419 | $110,713 | $28,350 | $82,363 |
| 2017 | $3,166 | $103,244 | $28,350 | $74,894 |
| 2016 | $2,888 | $95,064 | $28,350 | $66,714 |
| 2015 | $2,909 | $95,544 | $28,350 | $67,194 |
| 2014 | $2,943 | $96,417 | $28,350 | $68,067 |
Source: Public Records
Map
Nearby Homes
- 255 Pinewood Cir
- 107 Skyline Ridge
- 230 Pinewood Cir
- 123 Skyline Ridge
- 301 Skyline Pkwy
- 305 Skyline Pkwy
- 215 Pinewood Cir
- 265 Pinewood Cir
- 150 Lakeview Rd
- 250 Pinewood Cir
- 133 Skyline Ridge
- 210 Pinewood Cir
- 309 Skyline Pkwy
- 275 Pinewood Cir
- 295 Skyline Pkwy
- 126 Skyline Ridge
- 290 Pinewood Cir
- 290 Skyline Pkwy
- 300 Skyline Pkwy
- 285 Pinewood Cir