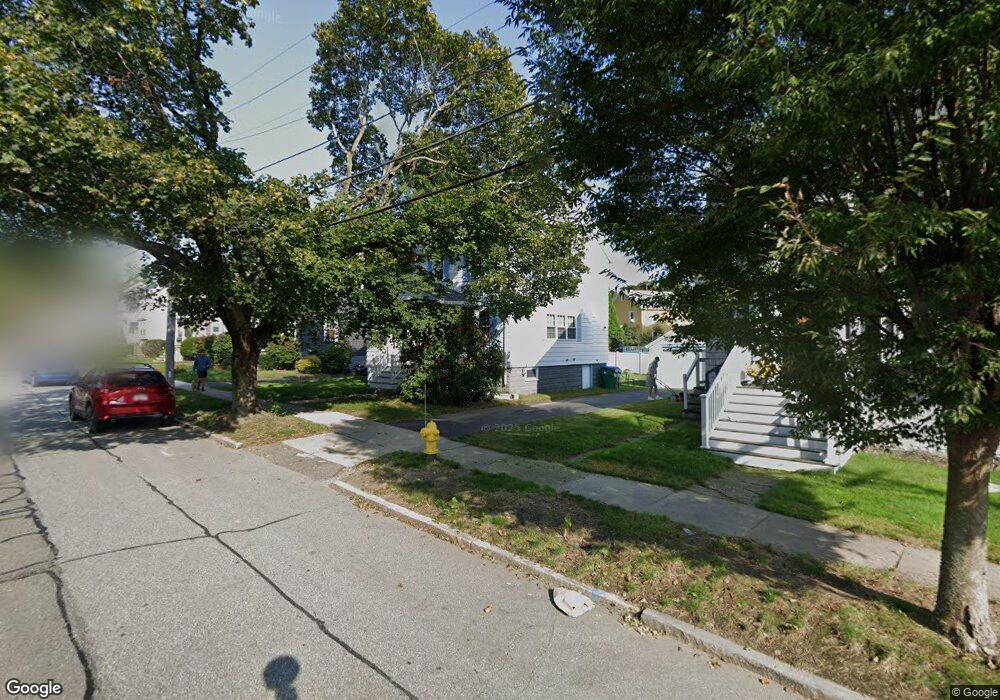
235 Playstead Rd Medford, MA 02155
West Medford NeighborhoodEstimated Value: $831,626 - $959,000
3
Beds
1
Bath
1,392
Sq Ft
$657/Sq Ft
Est. Value
About This Home
This home is located at 235 Playstead Rd, Medford, MA 02155 and is currently estimated at $913,907, approximately $656 per square foot. 235 Playstead Rd is a home located in Middlesex County with nearby schools including Medford High School, Saint Raphael School, and St. Joseph School.
Ownership History
Date
Name
Owned For
Owner Type
Purchase Details
Closed on
Jul 20, 1993
Sold by
Regan Joseph and Regan Mary B
Bought by
Baker Stephen C and Baker Robin L
Current Estimated Value
Home Financials for this Owner
Home Financials are based on the most recent Mortgage that was taken out on this home.
Original Mortgage
$162,000
Interest Rate
7.4%
Mortgage Type
Purchase Money Mortgage
Create a Home Valuation Report for This Property
The Home Valuation Report is an in-depth analysis detailing your home's value as well as a comparison with similar homes in the area
Home Values in the Area
Average Home Value in this Area
Purchase History
| Date | Buyer | Sale Price | Title Company |
|---|---|---|---|
| Baker Stephen C | $160,000 | -- |
Source: Public Records
Mortgage History
| Date | Status | Borrower | Loan Amount |
|---|---|---|---|
| Open | Baker Stephen C | $28,000 | |
| Closed | Baker Stephen C | $162,000 |
Source: Public Records
Tax History Compared to Growth
Tax History
| Year | Tax Paid | Tax Assessment Tax Assessment Total Assessment is a certain percentage of the fair market value that is determined by local assessors to be the total taxable value of land and additions on the property. | Land | Improvement |
|---|---|---|---|---|
| 2025 | $6,703 | $761,700 | $461,600 | $300,100 |
| 2024 | $6,260 | $734,800 | $439,600 | $295,200 |
| 2023 | $5,952 | $688,100 | $410,800 | $277,300 |
| 2022 | $5,776 | $641,100 | $373,500 | $267,600 |
| 2021 | $5,582 | $593,200 | $355,700 | $237,500 |
| 2020 | $5,469 | $595,700 | $355,700 | $240,000 |
| 2019 | $5,233 | $545,100 | $323,300 | $221,800 |
| 2018 | $5,131 | $501,100 | $293,900 | $207,200 |
| 2017 | $4,966 | $470,300 | $274,700 | $195,600 |
| 2016 | $4,637 | $414,400 | $249,800 | $164,600 |
| 2015 | $4,563 | $390,000 | $237,900 | $152,100 |
Source: Public Records
Map
Nearby Homes
- 595 Winthrop St
- 19 Shirley Rd
- 545 Winthrop St Unit Lot 9
- 545 Winthrop St Unit Lot 7
- 545 Winthrop St Unit Lot D
- 9 Wildwood Rd
- 40 Century St
- 141 Brooks St
- 115 Warren St Unit 2
- 26 North Gateway
- 211 Grove St
- 19 Town Way
- 5 Norwich Cir
- 35 Grove St
- 39 Town Way
- 421 High St Unit 203
- 421 High St Unit 205
- 421 High St Unit 202
- 421 High St Unit 204
- 421 High St Unit 307
- 233 Playstead Rd
- 239 Playstead Rd
- 229 Playstead Rd
- 27 Osborne Rd
- 243 Playstead Rd
- 37 Osborne Rd
- 225 Playstead Rd
- 21 Osborne Rd
- 247 Playstead Rd
- 15 Osborne Rd
- 221 Playstead Rd
- 34 Osborne Rd
- 251 Playstead Rd
- 28 Osborne Rd
- 40 Osborne Rd
- 46 Osborne Rd
- 11 Osborne Rd
- 24 Osborne Rd
- 18 Osborne Rd
- 54 Osborne Rd