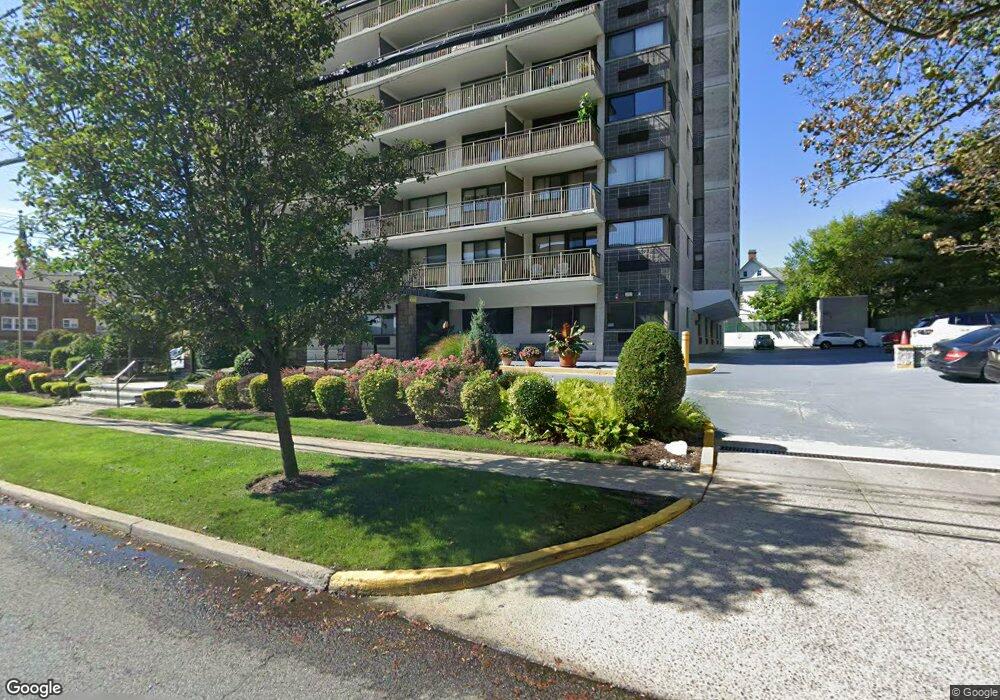
The Blair House 235 Prospect Ave Hackensack, NJ 07601
Estimated Value: $391,045 - $428,000
Studio
--
Bath
1,280
Sq Ft
$318/Sq Ft
Est. Value
About This Home
This home is located at 235 Prospect Ave, Hackensack, NJ 07601 and is currently estimated at $406,761, approximately $317 per square foot. 235 Prospect Ave is a home located in Bergen County with nearby schools including Hackensack High School and Bergen County Christian Academy.
Ownership History
Date
Name
Owned For
Owner Type
Purchase Details
Closed on
Jun 13, 2025
Sold by
Blanchette Kenneth Anthony and Blanchette Beverly Susan
Bought by
Oconnor Jolyn and Oconnor James
Current Estimated Value
Purchase Details
Closed on
Apr 25, 2023
Sold by
Hittner Jeffrey H
Bought by
Blanchette Kenneth Anthony
Home Financials for this Owner
Home Financials are based on the most recent Mortgage that was taken out on this home.
Original Mortgage
$225,000
Interest Rate
5.68%
Mortgage Type
New Conventional
Purchase Details
Closed on
May 22, 2013
Sold by
Ziomek Diane and Pellettieri Georgeann
Bought by
Hittner Jeffrey H
Purchase Details
Closed on
Oct 20, 2008
Sold by
Pellettieri Nick and Pellettieri Nikki
Bought by
Pellettieri Georgeann and Pellettieri Angela
Purchase Details
Closed on
Sep 1, 1993
Sold by
Goldberg William and Goldberg Marcia
Bought by
Pellettiei Nick and Pellettiei Nikki
Create a Home Valuation Report for This Property
The Home Valuation Report is an in-depth analysis detailing your home's value as well as a comparison with similar homes in the area
Home Values in the Area
Average Home Value in this Area
Purchase History
| Date | Buyer | Sale Price | Title Company |
|---|---|---|---|
| Oconnor Jolyn | $400,000 | Town Title | |
| Oconnor Jolyn | $400,000 | Town Title | |
| Blanchette Kenneth Anthony | $300,000 | Wfg National Title | |
| Blanchette Kenneth Anthony | $300,000 | Wfg National Title | |
| Hittner Jeffrey H | $182,500 | -- | |
| Pellettieri Georgeann | -- | -- | |
| Pellettiei Nick | $127,000 | -- |
Source: Public Records
Mortgage History
| Date | Status | Borrower | Loan Amount |
|---|---|---|---|
| Previous Owner | Blanchette Kenneth Anthony | $225,000 |
Source: Public Records
Tax History
| Year | Tax Paid | Tax Assessment Tax Assessment Total Assessment is a certain percentage of the fair market value that is determined by local assessors to be the total taxable value of land and additions on the property. | Land | Improvement |
|---|---|---|---|---|
| 2025 | $7,469 | $244,400 | $95,000 | $149,400 |
| 2024 | $7,036 | $244,400 | $95,000 | $149,400 |
| 2023 | $6,705 | $244,400 | $95,000 | $149,400 |
| 2022 | $6,705 | $239,300 | $90,000 | $149,300 |
| 2021 | $6,088 | $195,100 | $81,000 | $114,100 |
| 2020 | $6,456 | $195,100 | $81,000 | $114,100 |
| 2019 | $6,442 | $191,900 | $79,000 | $112,900 |
| 2018 | $6,451 | $189,000 | $76,500 | $112,500 |
| 2017 | $6,362 | $186,300 | $75,000 | $111,300 |
| 2016 | $6,253 | $185,100 | $75,000 | $110,100 |
| 2015 | $6,619 | $189,100 | $62,400 | $126,700 |
| 2014 | $6,282 | $189,100 | $62,400 | $126,700 |
Source: Public Records
About The Blair House
Map
Nearby Homes
- 235 Prospect Ave Unit 11A
- 245 Prospect Ave Unit 5B
- 245 Prospect Ave Unit 12B
- 245 Prospect Ave Unit 14D
- 277 Prospect Ave Unit 4A
- 277 Prospect Ave Unit 14B
- 277 Prospect Ave Unit 18B
- 277 Prospect Ave Unit 18H
- 280 Prospect Ave Unit 9H
- 280 Prospect Ave Unit 11H
- 280 Prospect Ave Unit 5D
- 280 Prospect Ave Unit 6J
- 307 Prospect Ave Unit 14I
- 307 Prospect Ave Unit 17D
- 307 Prospect Ave Unit 16A
- 316 Prospect Ave Unit 8D
- 316 Prospect Ave Unit 8H
- 316 Prospect Ave Unit 7E
- 316 Prospect Ave Unit 2D
- 298 3rd St
- 235 Prospect Ave Unit A
- 235 Prospect Ave Unit 8F
- 235 Prospect Ave
- 235 Prospect Ave
- 235 Prospect Ave
- 235 Prospect Ave
- 235 Prospect Ave
- 235 Prospect Ave
- 235 Prospect Ave
- 235 Prospect Ave
- 235 Prospect Ave
- 235 Prospect Ave
- 235 Prospect Ave
- 235 Prospect Ave
- 235 Prospect Ave
- 235 Prospect Ave
- 235 Prospect Ave
- 235 Prospect Ave
- 235 Prospect Ave
- 235 Prospect Ave
Your Personal Tour Guide
Ask me questions while you tour the home.