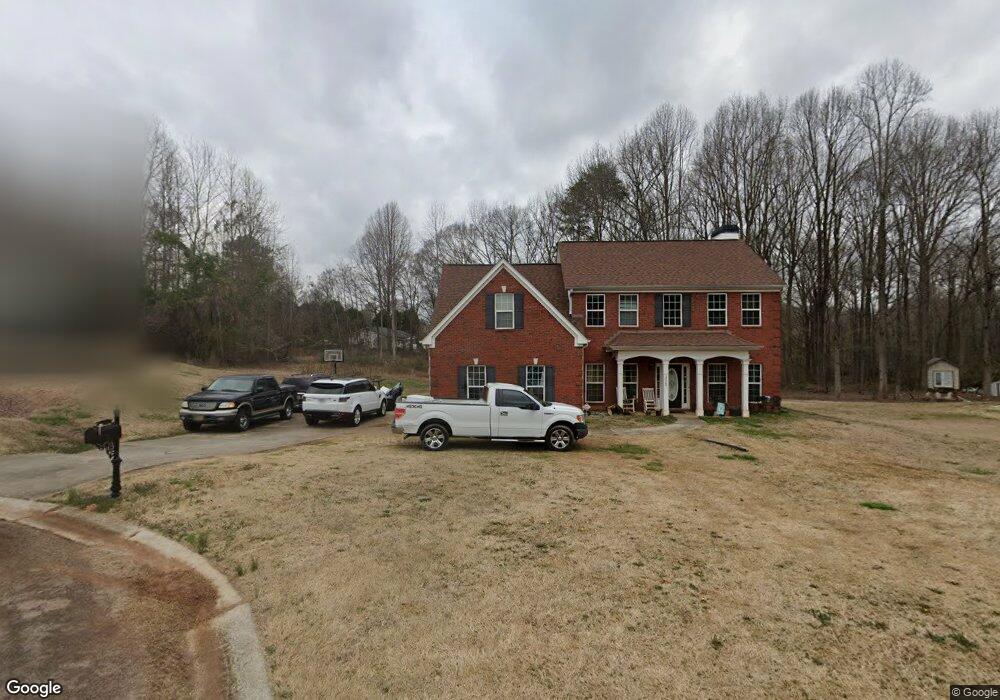
235 Psalms Dr Unit 11 A Jefferson, GA 30549
Estimated Value: $392,933 - $411,000
4
Beds
3
Baths
2,354
Sq Ft
$170/Sq Ft
Est. Value
About This Home
This home is located at 235 Psalms Dr Unit 11 A, Jefferson, GA 30549 and is currently estimated at $400,983, approximately $170 per square foot. 235 Psalms Dr Unit 11 A is a home located in Jackson County with nearby schools including Satilla Elementary School, East Jackson Elementary School, and East Jackson Middle School.
Ownership History
Date
Name
Owned For
Owner Type
Purchase Details
Closed on
Jan 27, 2012
Bought by
Varnum Doncrecia R
Current Estimated Value
Purchase Details
Closed on
Sep 14, 2011
Sold by
Deutsche Bank National
Bought by
Clark Marty
Purchase Details
Closed on
Apr 6, 2010
Sold by
Reno Roger A
Bought by
Deutsche Bank National C
Purchase Details
Closed on
Jul 16, 2004
Sold by
Town & Country Homes Llc
Bought by
Reno Roger A and Reno Debra K
Purchase Details
Closed on
Sep 19, 2003
Sold by
Canup Terry
Bought by
Town & Country Homes Llc
Purchase Details
Closed on
Aug 7, 2002
Sold by
Porter Donald
Bought by
Canup Terry
Create a Home Valuation Report for This Property
The Home Valuation Report is an in-depth analysis detailing your home's value as well as a comparison with similar homes in the area
Home Values in the Area
Average Home Value in this Area
Purchase History
| Date | Buyer | Sale Price | Title Company |
|---|---|---|---|
| Varnum Doncrecia R | $125,000 | -- | |
| Clark Marty | $80,699 | -- | |
| Deutsche Bank National C | $147,500 | -- | |
| Reno Roger A | $176,700 | -- | |
| Town & Country Homes Llc | -- | -- | |
| Canup Terry | $793,000 | -- |
Source: Public Records
Tax History Compared to Growth
Tax History
| Year | Tax Paid | Tax Assessment Tax Assessment Total Assessment is a certain percentage of the fair market value that is determined by local assessors to be the total taxable value of land and additions on the property. | Land | Improvement |
|---|---|---|---|---|
| 2024 | $3,140 | $122,760 | $20,000 | $102,760 |
| 2023 | $3,173 | $111,840 | $20,000 | $91,840 |
| 2022 | $2,738 | $93,240 | $20,000 | $73,240 |
| 2021 | $2,757 | $93,240 | $20,000 | $73,240 |
| 2020 | $2,414 | $74,680 | $14,560 | $60,120 |
| 2019 | $2,444 | $74,520 | $14,560 | $59,960 |
| 2018 | $2,380 | $71,600 | $14,560 | $57,040 |
| 2017 | $2,231 | $67,570 | $14,560 | $53,010 |
| 2016 | $2,243 | $67,570 | $14,560 | $53,010 |
| 2015 | $2,208 | $66,210 | $13,200 | $53,010 |
| 2014 | $2,059 | $61,242 | $13,200 | $48,042 |
| 2013 | -- | $61,241 | $13,200 | $48,041 |
Source: Public Records
Map
Nearby Homes
- 0 Brockton Loop Unit 10645336
- 00 Brockton Loop
- 45 Hometown Ct
- 41 Hometown Ct
- 37 Hometown Ct
- 33 Hometown Ct
- 51 Howington Rd
- 51 Howiington Rd
- 19 Redtail Rd
- 169 Grandview Dr
- 486 Glenside Dr
- 134 Oakdale Rd
- 134 Oakdale Rd Unit 31
- 150 Oakdale Rd Unit 32
- 150 Oakdale Rd
- 164 Oakdale Rd
- 164 Oakdale Rd Unit 33
- 174 Oakdale Rd Unit 34
- 174 Oakdale Rd
- 372 Glenside Dr
- 235 Psalms Dr
- 259 Psalms Dr
- 221 Psalms Dr
- 267 Palm Way
- 211 Psalms Dr
- 248 Psalms Dr
- 283 Psalms Dr
- 197 Psalms Dr
- 258 Mauldin Rd
- 182 Psalms Dr
- 290 Psalms Dr
- 307 Psalms Dr
- 173 Psalms Dr
- 158 Psalms Dr
- 320 Psalms Dr
- 331 Psalms Dr
- 0 Psalms Dr Unit 7239909
- 0 Psalms Dr Unit 7192787
- 0 Psalms Dr Unit 8808255
- 0 Psalms Dr Unit 8793372