Estimated Value: $140,000 - $162,000
2
Beds
1
Bath
851
Sq Ft
$175/Sq Ft
Est. Value
About This Home
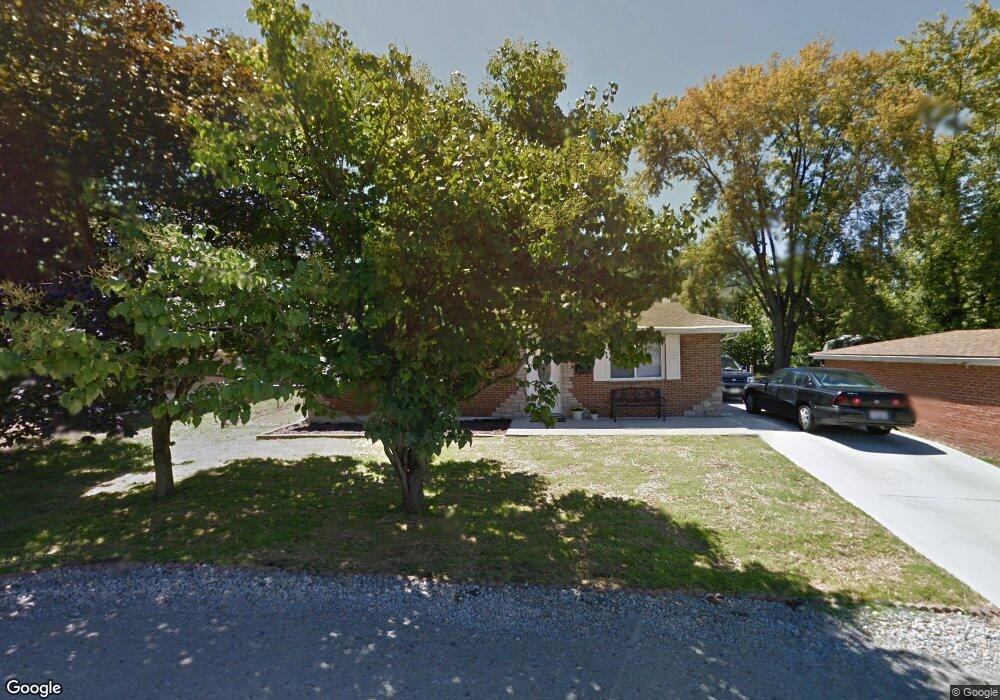
This home is located at 235 Race St, Xenia, OH 45385 and is currently estimated at $148,635, approximately $174 per square foot. 235 Race St is a home located in Greene County with nearby schools including Xenia High School, Summit Academy Community School for Alternative Learners - Xenia, and Legacy Christian Academy.
Ownership History
Date
Name
Owned For
Owner Type
Purchase Details
Closed on
Aug 24, 2011
Sold by
Fannie Mae
Bought by
Lombard Thomas A
Current Estimated Value
Purchase Details
Closed on
Aug 5, 2011
Sold by
Tackett Kristen E
Bought by
Federal National Mortgage Association
Purchase Details
Closed on
May 18, 2007
Sold by
Schmidt James W
Bought by
Tackett Kristen E
Home Financials for this Owner
Home Financials are based on the most recent Mortgage that was taken out on this home.
Original Mortgage
$54,000
Interest Rate
6.2%
Mortgage Type
Unknown
Create a Home Valuation Report for This Property
The Home Valuation Report is an in-depth analysis detailing your home's value as well as a comparison with similar homes in the area
Home Values in the Area
Average Home Value in this Area
Purchase History
| Date | Buyer | Sale Price | Title Company |
|---|---|---|---|
| Lombard Thomas A | $30,000 | Omega Title Agency Llc | |
| Federal National Mortgage Association | $57,171 | Attorney | |
| Tackett Kristen E | $54,000 | Attorney |
Source: Public Records
Mortgage History
| Date | Status | Borrower | Loan Amount |
|---|---|---|---|
| Previous Owner | Tackett Kristen E | $54,000 |
Source: Public Records
Tax History Compared to Growth
Tax History
| Year | Tax Paid | Tax Assessment Tax Assessment Total Assessment is a certain percentage of the fair market value that is determined by local assessors to be the total taxable value of land and additions on the property. | Land | Improvement |
|---|---|---|---|---|
| 2024 | $1,456 | $34,030 | $3,730 | $30,300 |
| 2023 | $1,456 | $34,030 | $3,730 | $30,300 |
| 2022 | $1,278 | $25,470 | $2,330 | $23,140 |
| 2021 | $1,295 | $25,470 | $2,330 | $23,140 |
| 2020 | $1,241 | $25,470 | $2,330 | $23,140 |
| 2019 | $981 | $18,950 | $2,940 | $16,010 |
| 2018 | $984 | $18,950 | $2,940 | $16,010 |
| 2017 | $956 | $18,950 | $2,940 | $16,010 |
| 2016 | $1,002 | $18,920 | $2,940 | $15,980 |
| 2015 | $1,004 | $18,920 | $2,940 | $15,980 |
| 2014 | $962 | $18,920 | $2,940 | $15,980 |
Source: Public Records
Map
Nearby Homes