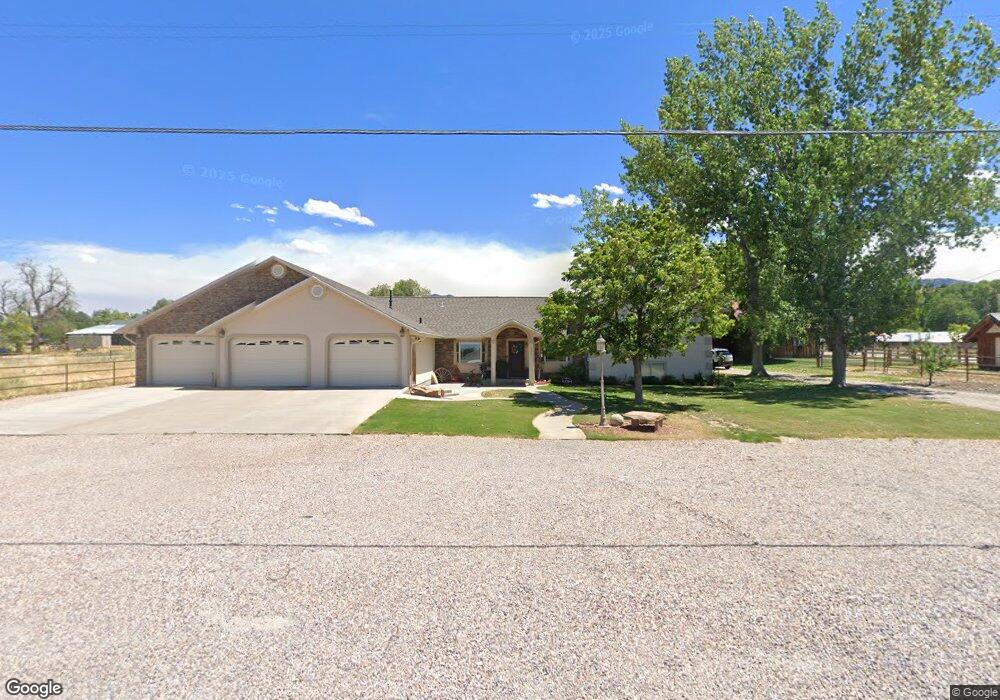
235 S 100 W Fillmore, UT 84631
Estimated Value: $282,000 - $368,000
3
Beds
2
Baths
1,595
Sq Ft
$211/Sq Ft
Est. Value
About This Home
This home is located at 235 S 100 W, Fillmore, UT 84631 and is currently estimated at $336,064, approximately $210 per square foot. 235 S 100 W is a home located in Millard County.
Ownership History
Date
Name
Owned For
Owner Type
Purchase Details
Closed on
Apr 12, 2022
Sold by
Ewert Peter H and Ewert Kristine W
Bought by
Ewert Family Living Trust
Current Estimated Value
Purchase Details
Closed on
Jun 4, 2012
Sold by
Corporation Of The Presiding Bishop Of T
Bought by
Ewart Peter H and Ewart Kristine W
Purchase Details
Closed on
Sep 21, 2011
Sold by
Loertscher Benjamin T and Loertscher Mary M
Bought by
Loertscher Benjamin and Loertscher Mary Margartet
Home Financials for this Owner
Home Financials are based on the most recent Mortgage that was taken out on this home.
Original Mortgage
$85,000
Interest Rate
4.16%
Mortgage Type
New Conventional
Purchase Details
Closed on
Sep 1, 2006
Sold by
Packard Hayes Ann and Hayes Ann P
Bought by
Loertscher Benjamin T and Loertscher Loertscher Mary M
Home Financials for this Owner
Home Financials are based on the most recent Mortgage that was taken out on this home.
Original Mortgage
$87,000
Interest Rate
6.56%
Mortgage Type
New Conventional
Create a Home Valuation Report for This Property
The Home Valuation Report is an in-depth analysis detailing your home's value as well as a comparison with similar homes in the area
Home Values in the Area
Average Home Value in this Area
Purchase History
| Date | Buyer | Sale Price | Title Company |
|---|---|---|---|
| Ewert Family Living Trust | -- | -- | |
| Ewart Peter H | -- | First American Title Insuran | |
| Corporation Of The Presiding Bishop Of T | -- | First American Title Insuran | |
| Loertscher Benjamin | -- | -- | |
| Loertscher Benjamin T | -- | -- |
Source: Public Records
Mortgage History
| Date | Status | Borrower | Loan Amount |
|---|---|---|---|
| Previous Owner | Loertscher Benjamin | $85,000 | |
| Previous Owner | Loertscher Benjamin T | $87,000 |
Source: Public Records
Tax History Compared to Growth
Tax History
| Year | Tax Paid | Tax Assessment Tax Assessment Total Assessment is a certain percentage of the fair market value that is determined by local assessors to be the total taxable value of land and additions on the property. | Land | Improvement |
|---|---|---|---|---|
| 2025 | -- | $148,083 | $22,046 | $126,037 |
| 2024 | $135,544 | $135,544 | $20,292 | $115,252 |
| 2023 | $1,468 | $135,544 | $20,292 | $115,252 |
| 2022 | $0 | $118,533 | $18,448 | $100,085 |
| 2021 | $0 | $100,149 | $11,979 | $88,170 |
| 2020 | $872 | $93,341 | $10,890 | $82,451 |
| 2019 | $872 | $79,549 | $10,890 | $68,659 |
| 2018 | $872 | $77,613 | $10,890 | $66,723 |
| 2017 | $810 | $68,555 | $10,890 | $57,665 |
| 2016 | $775 | $68,555 | $10,890 | $57,665 |
| 2015 | $775 | $68,555 | $10,890 | $57,665 |
| 2014 | -- | $64,597 | $10,890 | $53,707 |
| 2013 | -- | $64,597 | $10,890 | $53,707 |
Source: Public Records
Map
Nearby Homes
- 190 W 400 St S
- 40 S 100 Rd E
- 220 S 200 E
- 75 N 100 West St
- 155 E 500 St S
- 157 E 500 South St
- 165 N 100 W
- 310 S 500 West Rd
- 225 W 200 St N
- 405 E 500 St S
- 430 E Canyon Rd
- 295 N 100 West St
- 310 S 600 E
- 390 N 100 W
- 380 N 200 St W
- 335 W 400 North St
- 760 E 700 St S
- 690 E 500 S
- 750 800 South Fillmore
- 825 800 South Fillmore