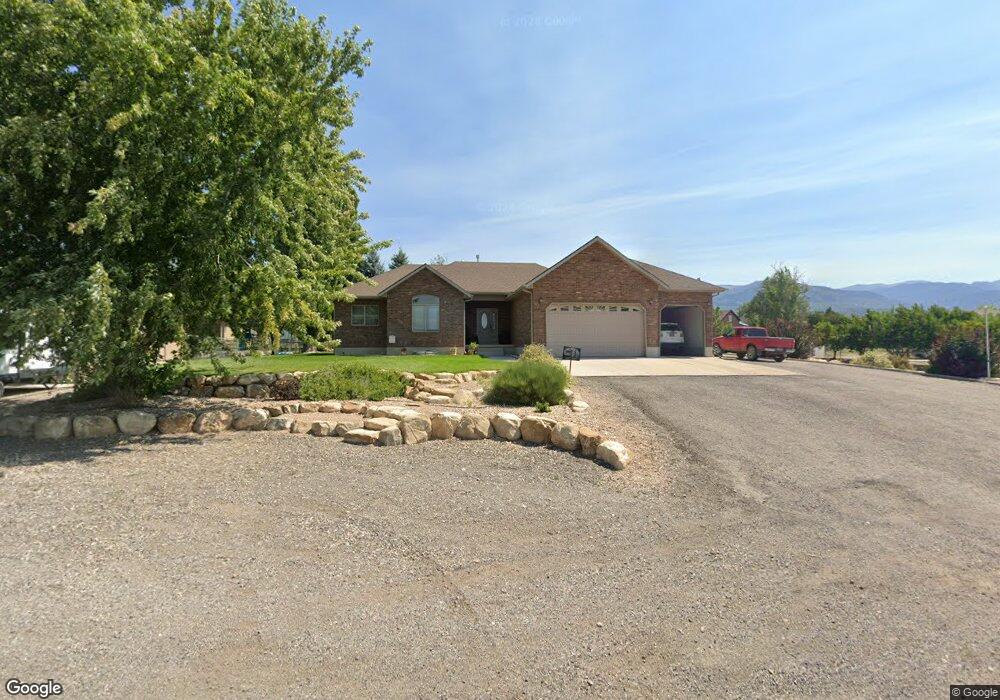
235 S 600 E Mount Pleasant, UT 84647
Estimated Value: $517,000 - $673,469
6
Beds
4
Baths
3,082
Sq Ft
$187/Sq Ft
Est. Value
About This Home
This home is located at 235 S 600 E, Mount Pleasant, UT 84647 and is currently estimated at $576,867, approximately $187 per square foot. 235 S 600 E is a home located in Sanpete County with nearby schools including North Sanpete High School and Wasatch Academy.
Ownership History
Date
Name
Owned For
Owner Type
Purchase Details
Closed on
Sep 12, 2019
Sold by
Goble and Stacey
Bought by
Mecham Jared
Current Estimated Value
Home Financials for this Owner
Home Financials are based on the most recent Mortgage that was taken out on this home.
Original Mortgage
$125,000
Outstanding Balance
$109,001
Interest Rate
3.7%
Mortgage Type
Construction
Estimated Equity
$467,866
Purchase Details
Closed on
Mar 10, 2009
Sold by
Goble Rick
Bought by
Goble Rick and Goble Stacey
Purchase Details
Closed on
Feb 11, 2009
Sold by
Goble Rick and Goble Stacey
Bought by
Goble Rick
Create a Home Valuation Report for This Property
The Home Valuation Report is an in-depth analysis detailing your home's value as well as a comparison with similar homes in the area
Home Values in the Area
Average Home Value in this Area
Purchase History
| Date | Buyer | Sale Price | Title Company |
|---|---|---|---|
| Mecham Jared | $156,250 | First American-Ephraim | |
| Goble Rick | -- | -- | |
| Goble Rick | -- | -- |
Source: Public Records
Mortgage History
| Date | Status | Borrower | Loan Amount |
|---|---|---|---|
| Open | Mecham Jared | $125,000 |
Source: Public Records
Tax History
| Year | Tax Paid | Tax Assessment Tax Assessment Total Assessment is a certain percentage of the fair market value that is determined by local assessors to be the total taxable value of land and additions on the property. | Land | Improvement |
|---|---|---|---|---|
| 2025 | $3,129 | $353,586 | $0 | $0 |
| 2024 | $3,047 | $324,613 | $0 | $0 |
| 2023 | $2,973 | $304,801 | $0 | $0 |
| 2022 | $2,976 | $272,144 | $0 | $0 |
| 2021 | $2,587 | $214,595 | $0 | $0 |
| 2020 | $2,430 | $183,766 | $0 | $0 |
| 2019 | $2,394 | $170,489 | $0 | $0 |
| 2018 | $2,197 | $269,548 | $31,016 | $238,532 |
| 2017 | $2,076 | $142,004 | $0 | $0 |
| 2016 | $1,931 | $132,087 | $0 | $0 |
| 2015 | $1,943 | $132,087 | $0 | $0 |
| 2014 | $1,983 | $132,087 | $0 | $0 |
| 2013 | $1,864 | $132,087 | $0 | $0 |
Source: Public Records
Map
Nearby Homes
Your Personal Tour Guide
Ask me questions while you tour the home.