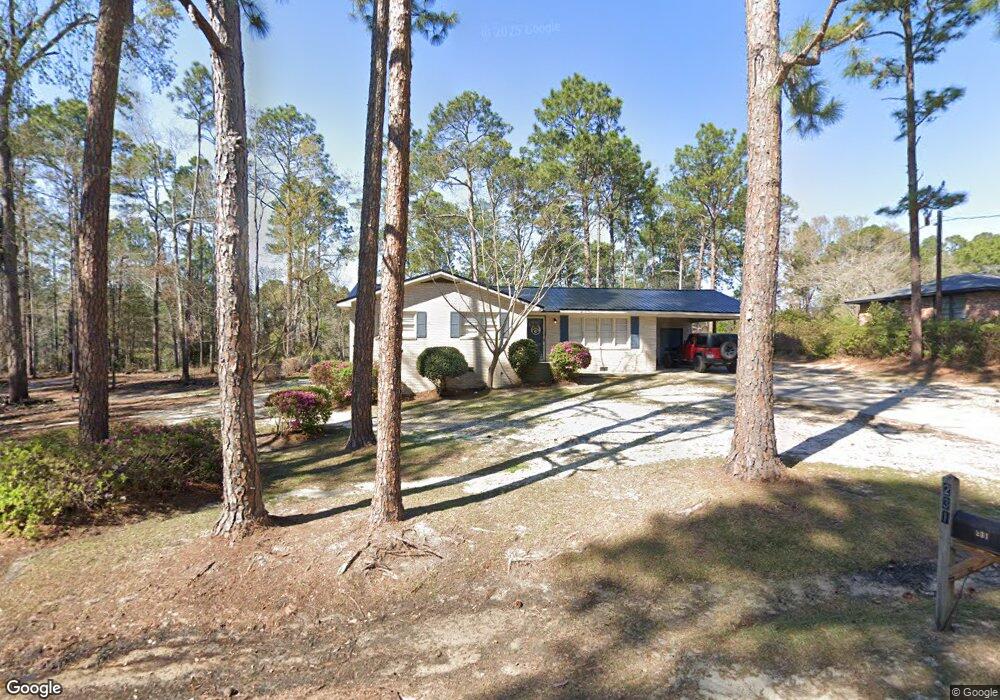
235 S Anderson Dr Swainsboro, GA 30401
Estimated Value: $128,163 - $159,000
3
Beds
1
Bath
1,371
Sq Ft
$106/Sq Ft
Est. Value
About This Home
This home is located at 235 S Anderson Dr, Swainsboro, GA 30401 and is currently estimated at $145,541, approximately $106 per square foot. 235 S Anderson Dr is a home with nearby schools including Swainsboro Primary School, Swainsboro Elementary School, and Swainsboro Middle School.
Ownership History
Date
Name
Owned For
Owner Type
Purchase Details
Closed on
Jul 26, 2024
Sold by
Osborn Lillian P
Bought by
Smith Janice
Current Estimated Value
Purchase Details
Closed on
Jun 15, 1984
Sold by
Osborn Thomas W
Bought by
Osborn Lillian P
Create a Home Valuation Report for This Property
The Home Valuation Report is an in-depth analysis detailing your home's value as well as a comparison with similar homes in the area
Home Values in the Area
Average Home Value in this Area
Purchase History
| Date | Buyer | Sale Price | Title Company |
|---|---|---|---|
| Smith Janice | -- | -- | |
| Osborn Lillian P | -- | -- |
Source: Public Records
Tax History Compared to Growth
Tax History
| Year | Tax Paid | Tax Assessment Tax Assessment Total Assessment is a certain percentage of the fair market value that is determined by local assessors to be the total taxable value of land and additions on the property. | Land | Improvement |
|---|---|---|---|---|
| 2024 | $1,402 | $40,413 | $1,270 | $39,143 |
| 2023 | $1,288 | $37,340 | $1,270 | $36,070 |
| 2022 | $607 | $31,588 | $1,270 | $30,318 |
| 2021 | $565 | $29,434 | $1,104 | $28,330 |
| 2020 | $436 | $23,471 | $1,600 | $21,871 |
| 2019 | $436 | $23,471 | $1,600 | $21,871 |
| 2018 | $621 | $23,471 | $1,600 | $21,871 |
| 2017 | $622 | $23,471 | $1,600 | $21,871 |
| 2016 | $434 | $23,471 | $1,600 | $21,871 |
| 2015 | -- | $23,471 | $1,600 | $21,871 |
| 2014 | -- | $23,118 | $1,600 | $21,518 |
| 2013 | -- | $21,559 | $1,600 | $19,959 |
Source: Public Records
Map
Nearby Homes
- 167 Fortune Loop
- 0 Mcleod Dr
- 114 Happiness Dr
- 542 Jones Ave
- 843 Prosperity Dr
- 849 Prosperity Dr
- 178 Advantage Ln
- 875 Prosperity Dr
- 118 Pierce Ave
- 310 Advantage Ln
- 331 S Green St
- 209 Price St
- 240 Lakewood Dr
- 323 N Main St
- 423 E Martin Luther King Junior Blvd
- 316 W Moring St
- 219 Lucky St
- 400 N Main St
- 402 N Main St
- 11 Plantation Dr
- 241 S Anderson Dr
- 231 S Anderson Dr
- 242 S Anderson Dr
- 552 Colegrove Dr
- 621 Hardin Dr
- 614 Hardin Dr
- 548 Colegrove Dr
- 226 S Anderson Dr
- S S Anderson Dr
- 544 Colegrove Dr
- 222 S Anderson Dr
- 622 Hardin Dr
- 218 S Anderson Dr
- 211 Sheppard Dr
- 538 Colegrove Dr
- 314 Thigpen Dr
- 207 Shepard Dr
- 625 Hardin Dr
- 638 Hardin Dr
- 615 Turner Dr