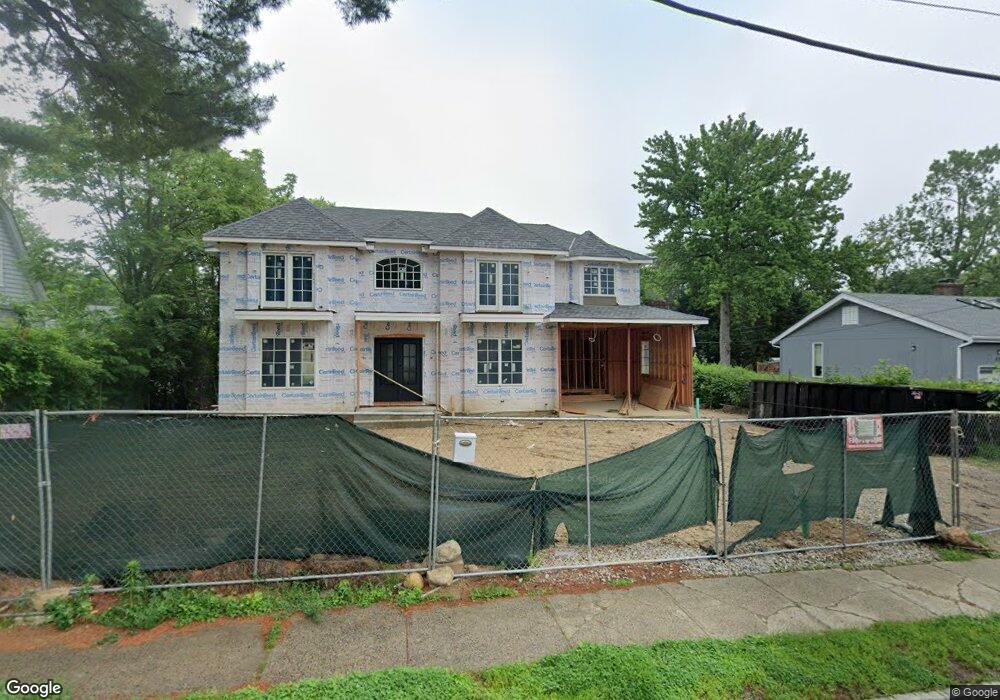
235 Schenck Ave Great Neck, NY 11021
Estimated Value: $1,117,000 - $1,265,595
3
Beds
3
Baths
1,835
Sq Ft
$649/Sq Ft
Est. Value
About This Home
This home is located at 235 Schenck Ave, Great Neck, NY 11021 and is currently estimated at $1,191,298, approximately $649 per square foot. 235 Schenck Ave is a home located in Nassau County with nearby schools including Elizabeth M. Baker Elementary School, Great Neck South Middle School, and Richard S. Sherman - Great Neck North Middle School.
Ownership History
Date
Name
Owned For
Owner Type
Purchase Details
Closed on
Feb 15, 2022
Sold by
Channel Equities Realty Inc
Bought by
Mottahedeh Don
Current Estimated Value
Home Financials for this Owner
Home Financials are based on the most recent Mortgage that was taken out on this home.
Original Mortgage
$500,000
Interest Rate
3.92%
Mortgage Type
Stand Alone First
Purchase Details
Closed on
Apr 20, 1999
Sold by
Iversen Wilhelm and Iversen Vivienne T
Bought by
Channel Equities Realty Inc
Purchase Details
Closed on
Feb 23, 1995
Sold by
Iversen Wilhelm and Iversen Vivienne
Bought by
Wilhelm Iversen Revocable Livi Ng Trust and Vivienne T Iversen Revocable L Iving Trust
Create a Home Valuation Report for This Property
The Home Valuation Report is an in-depth analysis detailing your home's value as well as a comparison with similar homes in the area
Home Values in the Area
Average Home Value in this Area
Purchase History
| Date | Buyer | Sale Price | Title Company |
|---|---|---|---|
| Mottahedeh Don | $850,000 | Judicial Title | |
| Mottahedeh Don | $850,000 | Judicial Title | |
| Mottahedeh Don | $850,000 | Judicial Title | |
| Mottahedeh Don | $850,000 | Judicial Title | |
| Channel Equities Realty Inc | $300,000 | Chicago Title Insurance Co | |
| Channel Equities Realty Inc | $300,000 | Chicago Title Insurance Co | |
| Channel Equities Realty Inc | $300,000 | Chicago Title Insurance Co | |
| Wilhelm Iversen Revocable Livi Ng Trust | -- | -- | |
| Wilhelm Iversen Revocable Livi Ng Trust | -- | -- |
Source: Public Records
Mortgage History
| Date | Status | Borrower | Loan Amount |
|---|---|---|---|
| Closed | Mottahedeh Don | $500,000 |
Source: Public Records
Tax History Compared to Growth
Tax History
| Year | Tax Paid | Tax Assessment Tax Assessment Total Assessment is a certain percentage of the fair market value that is determined by local assessors to be the total taxable value of land and additions on the property. | Land | Improvement |
|---|---|---|---|---|
| 2025 | $20,363 | $1,046 | $652 | $394 |
| 2024 | $5,966 | $1,046 | $652 | $394 |
| 2023 | $18,497 | $1,108 | $695 | $413 |
| 2022 | $18,497 | $1,046 | $652 | $394 |
| 2021 | $16,207 | $1,104 | $688 | $416 |
| 2020 | $14,567 | $1,288 | $1,287 | $1 |
| 2019 | $14,466 | $1,380 | $1,375 | $5 |
| 2018 | $14,466 | $1,424 | $0 | $0 |
| 2017 | $9,188 | $1,424 | $1,136 | $288 |
| 2016 | $13,795 | $1,508 | $1,203 | $305 |
| 2015 | $5,479 | $1,779 | $1,419 | $360 |
| 2014 | $5,479 | $1,779 | $1,419 | $360 |
| 2013 | $5,229 | $1,779 | $1,419 | $360 |
Source: Public Records
Map
Nearby Homes
- 256 Schenck Ave
- 7 Terrace Dr Unit 3H
- 12 Longview Place
- 125 Colonial Rd
- 11 Valley View Rd
- 88 Manor Dr
- 92 Manor Dr
- 106 Grandview Ave
- 195 S Middle Neck Rd Unit 2-L
- 185 S Middle Neck Rd Unit 1G
- 200 S Middle Neck Rd Unit J-6
- 180 S Middle Neck Rd Unit 2-A
- 90 Schenck Ave Unit 2L
- 45 Hill Park Ave Unit Pr2
- 45 Hill Park Ave Unit 2L
- 50 Hill Park Ave Unit 2F
- 20 Hill Park Ave Unit 1G
- 15 Hill Park Ave Unit 1C
- 15 Hill Park Ave Unit 2-C
- 15 Hill Park Ave Unit 2O