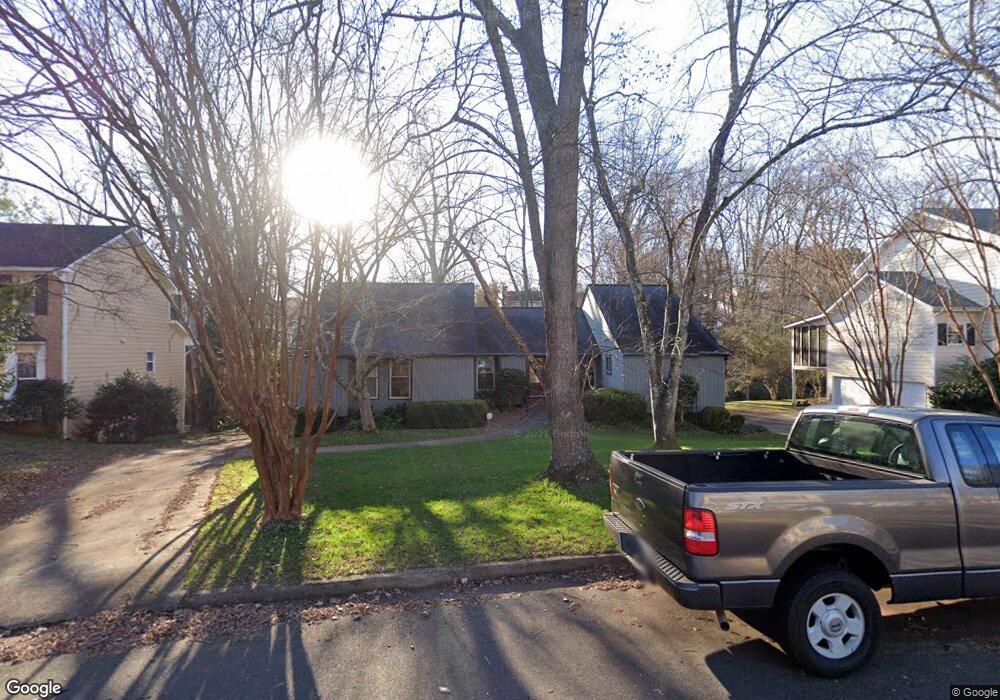
235 Softwood Cir Unit 3B Roswell, GA 30076
Martin's Landing NeighborhoodEstimated Value: $492,542 - $525,000
3
Beds
2
Baths
1,961
Sq Ft
$261/Sq Ft
Est. Value
About This Home
This home is located at 235 Softwood Cir Unit 3B, Roswell, GA 30076 and is currently estimated at $511,386, approximately $260 per square foot. 235 Softwood Cir Unit 3B is a home located in Fulton County with nearby schools including Jackson Elementary School, Holcomb Bridge Middle School, and Centennial High School.
Ownership History
Date
Name
Owned For
Owner Type
Purchase Details
Closed on
Jun 1, 2001
Sold by
Craddock Richard D and Craddock Melissa D
Bought by
Gibbs John D and Gibbs Joann
Current Estimated Value
Home Financials for this Owner
Home Financials are based on the most recent Mortgage that was taken out on this home.
Original Mortgage
$193,800
Outstanding Balance
$73,337
Interest Rate
7.05%
Mortgage Type
New Conventional
Estimated Equity
$438,049
Purchase Details
Closed on
Jul 30, 1997
Sold by
Rosenberg Joel and Rosenberg Laurie S
Bought by
Craddock Richard D and Craddock Melissa D
Home Financials for this Owner
Home Financials are based on the most recent Mortgage that was taken out on this home.
Original Mortgage
$132,050
Interest Rate
7.5%
Mortgage Type
New Conventional
Create a Home Valuation Report for This Property
The Home Valuation Report is an in-depth analysis detailing your home's value as well as a comparison with similar homes in the area
Home Values in the Area
Average Home Value in this Area
Purchase History
| Date | Buyer | Sale Price | Title Company |
|---|---|---|---|
| Gibbs John D | $204,000 | -- | |
| Craddock Richard D | $139,000 | -- |
Source: Public Records
Mortgage History
| Date | Status | Borrower | Loan Amount |
|---|---|---|---|
| Open | Gibbs John D | $193,800 | |
| Previous Owner | Craddock Richard D | $132,050 |
Source: Public Records
Tax History Compared to Growth
Tax History
| Year | Tax Paid | Tax Assessment Tax Assessment Total Assessment is a certain percentage of the fair market value that is determined by local assessors to be the total taxable value of land and additions on the property. | Land | Improvement |
|---|---|---|---|---|
| 2025 | $512 | $168,000 | $38,080 | $129,920 |
| 2023 | $4,894 | $168,000 | $38,080 | $129,920 |
| 2022 | $2,096 | $148,120 | $28,320 | $119,800 |
| 2021 | $2,483 | $132,960 | $18,920 | $114,040 |
| 2020 | $2,518 | $120,120 | $24,040 | $96,080 |
| 2019 | $410 | $118,000 | $23,600 | $94,400 |
| 2018 | $2,469 | $103,880 | $15,800 | $88,080 |
| 2017 | $1,917 | $77,640 | $14,960 | $62,680 |
| 2016 | $1,915 | $77,640 | $14,960 | $62,680 |
| 2015 | $2,346 | $77,640 | $14,960 | $62,680 |
| 2014 | $1,615 | $65,440 | $10,320 | $55,120 |
Source: Public Records
Map
Nearby Homes
- 227 Quail Run
- 406 Teal Ct
- 309 Quail Run
- 311 Quail Run
- 263 Quail Run
- 324 Teal Ct
- 225 Winterberry Ct
- 230 Winterberry Ct
- 150 N Pond Ct Unit 1
- 230 Lakeview Ridge E
- 130 Lakeview Ridge W
- 125 N Pond Way
- 315 Sea Holly Cir
- 2240 Six Branches Dr
- 9470 Hillside Dr
- 1265 Northshore Dr
- 420 Little Pines Ct
- 645 Trailmore Place
- 680 Branch Valley Ct
- 1050 Terramont Dr
- 225 Softwood Cir
- 115 Floss Flower Ct Unit 1151
- 115 Floss Flower Ct
- 240 Softwood Cir
- 215 Softwood Cir
- 230 Softwood Cir
- 422 Teal Ct Unit 422
- 426 Teal Ct
- 260 Softwood Cir
- 430 Teal Ct Unit 430
- 416 Teal Ct Unit 416
- 412 Teal Ct
- 438 Teal Ct
- 265 Softwood Cir
- 408 Teal Ct Unit 408
- 420 Teal Ct
- 125 Floss Flower Ct
- 418 Teal Ct
- 432 Teal Ct Unit 432
- 404 Teal Ct