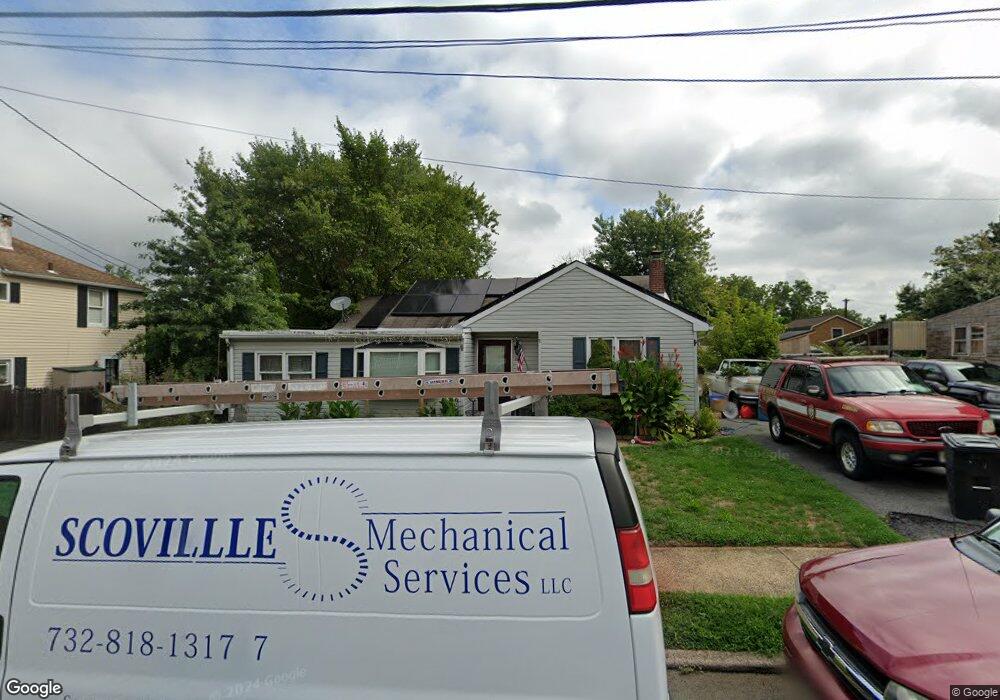
235 Spring St Bordentown, NJ 08505
Estimated Value: $333,000 - $389,000
--
Bed
--
Bath
1,342
Sq Ft
$264/Sq Ft
Est. Value
About This Home
This home is located at 235 Spring St, Bordentown, NJ 08505 and is currently estimated at $354,810, approximately $264 per square foot. 235 Spring St is a home located in Burlington County with nearby schools including Bordentown Reg High School and Meadow View Junior Academy.
Ownership History
Date
Name
Owned For
Owner Type
Purchase Details
Closed on
Jul 26, 2006
Sold by
Sedor Peter
Bought by
Sedor Peter
Current Estimated Value
Purchase Details
Closed on
Mar 17, 2004
Sold by
Sedor Peter and Sedor Barbara
Bought by
Sedor Peter
Home Financials for this Owner
Home Financials are based on the most recent Mortgage that was taken out on this home.
Original Mortgage
$136,500
Outstanding Balance
$63,302
Interest Rate
5.56%
Mortgage Type
New Conventional
Estimated Equity
$291,508
Purchase Details
Closed on
Jun 30, 1998
Sold by
Mosca Thomas B and Mosca Cheryl R
Bought by
Sedor Peter and Sedor Barbara
Create a Home Valuation Report for This Property
The Home Valuation Report is an in-depth analysis detailing your home's value as well as a comparison with similar homes in the area
Home Values in the Area
Average Home Value in this Area
Purchase History
| Date | Buyer | Sale Price | Title Company |
|---|---|---|---|
| Sedor Peter | -- | None Available | |
| Sedor Peter | -- | Allstates Title Service Inc | |
| Sedor Peter | $128,890 | -- |
Source: Public Records
Mortgage History
| Date | Status | Borrower | Loan Amount |
|---|---|---|---|
| Open | Sedor Peter | $136,500 |
Source: Public Records
Tax History Compared to Growth
Tax History
| Year | Tax Paid | Tax Assessment Tax Assessment Total Assessment is a certain percentage of the fair market value that is determined by local assessors to be the total taxable value of land and additions on the property. | Land | Improvement |
|---|---|---|---|---|
| 2025 | $7,106 | $193,000 | $77,200 | $115,800 |
| 2024 | $6,815 | $193,000 | $77,200 | $115,800 |
| 2023 | $6,815 | $193,000 | $77,200 | $115,800 |
| 2022 | $6,579 | $193,000 | $77,200 | $115,800 |
| 2021 | $6,659 | $193,000 | $77,200 | $115,800 |
| 2020 | $6,709 | $193,000 | $77,200 | $115,800 |
| 2019 | $6,786 | $193,000 | $77,200 | $115,800 |
| 2018 | $6,686 | $193,000 | $77,200 | $115,800 |
| 2017 | $6,491 | $193,000 | $77,200 | $115,800 |
| 2016 | $6,429 | $193,000 | $77,200 | $115,800 |
| 2015 | $6,383 | $193,000 | $77,200 | $115,800 |
| 2014 | $6,078 | $193,000 | $77,200 | $115,800 |
Source: Public Records
Map
Nearby Homes
- 97 Crosswicks St
- 51 Mary St
- 113 Mary St
- 137 2nd St
- 10 E Burlington St
- 61 Park St
- 16 2nd St
- 186 Crosswicks Rd
- 52 Thorntown Ln
- 2 Orchard Ave
- 46 W Constitution Dr
- 12 Ardmore Dr
- 14 Mill St
- 32 W Constitution Dr
- 254 Ward Ave
- 57 Hinkle Dr
- 9 Charles Bossert Dr
- 16 Lexington Rd
- 13 Stanton Ave
- 11 Fairfax Ct Unit 22172