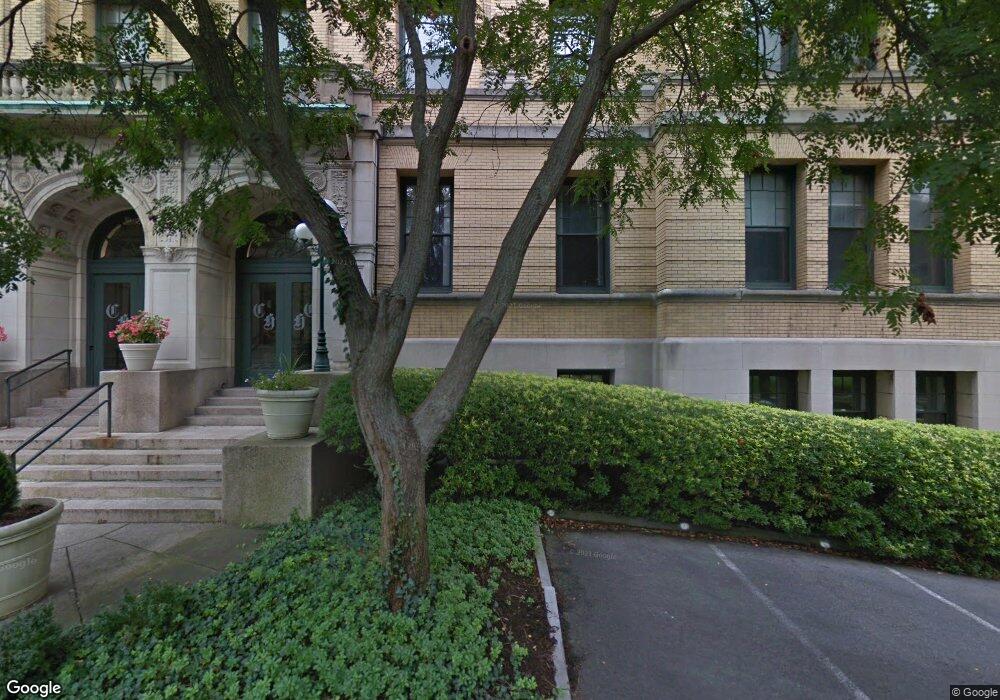
Classical High Condominiums 235 State St Unit 201 Springfield, MA 01103
Metro Center NeighborhoodEstimated Value: $203,000 - $227,000
2
Beds
1
Bath
1,000
Sq Ft
$215/Sq Ft
Est. Value
About This Home
This home is located at 235 State St Unit 201, Springfield, MA 01103 and is currently estimated at $215,415, approximately $215 per square foot. 235 State St Unit 201 is a home located in Hampden County with nearby schools including Milton Bradley School, South End Middle School, and High School Of Commerce.
Ownership History
Date
Name
Owned For
Owner Type
Purchase Details
Closed on
Oct 31, 2000
Sold by
Hutcheons Shawn W
Bought by
Deleon Victoria
Current Estimated Value
Home Financials for this Owner
Home Financials are based on the most recent Mortgage that was taken out on this home.
Original Mortgage
$71,200
Outstanding Balance
$26,142
Interest Rate
7.83%
Mortgage Type
Purchase Money Mortgage
Estimated Equity
$189,273
Purchase Details
Closed on
Jan 16, 1998
Sold by
Ohara Ryan A and Oddi Joseph M
Bought by
Hutcheons Shawn W
Home Financials for this Owner
Home Financials are based on the most recent Mortgage that was taken out on this home.
Original Mortgage
$41,400
Interest Rate
7.08%
Mortgage Type
Purchase Money Mortgage
Purchase Details
Closed on
Mar 1, 1991
Sold by
Marketplace Dev Corp
Bought by
Ohara Ryan A and Oddi Joseph M
Home Financials for this Owner
Home Financials are based on the most recent Mortgage that was taken out on this home.
Original Mortgage
$114,000
Interest Rate
9.69%
Mortgage Type
Purchase Money Mortgage
Create a Home Valuation Report for This Property
The Home Valuation Report is an in-depth analysis detailing your home's value as well as a comparison with similar homes in the area
Home Values in the Area
Average Home Value in this Area
Purchase History
| Date | Buyer | Sale Price | Title Company |
|---|---|---|---|
| Deleon Victoria | $89,000 | -- | |
| Hutcheons Shawn W | $46,000 | -- | |
| Ohara Ryan A | $126,000 | -- |
Source: Public Records
Mortgage History
| Date | Status | Borrower | Loan Amount |
|---|---|---|---|
| Open | Ohara Ryan A | $71,200 | |
| Previous Owner | Ohara Ryan A | $10,000 | |
| Previous Owner | Ohara Ryan A | $41,400 | |
| Previous Owner | Ohara Ryan A | $114,000 | |
| Closed | Ohara Ryan A | $6,000 |
Source: Public Records
Tax History
| Year | Tax Paid | Tax Assessment Tax Assessment Total Assessment is a certain percentage of the fair market value that is determined by local assessors to be the total taxable value of land and additions on the property. | Land | Improvement |
|---|---|---|---|---|
| 2025 | $3,042 | $194,000 | $0 | $194,000 |
| 2024 | $3,116 | $194,000 | $0 | $194,000 |
| 2023 | $2,725 | $159,800 | $0 | $159,800 |
| 2022 | $2,629 | $139,700 | $0 | $139,700 |
| 2021 | $2,493 | $131,900 | $0 | $131,900 |
| 2020 | $2,576 | $131,900 | $0 | $131,900 |
| 2019 | $2,596 | $131,900 | $0 | $131,900 |
| 2018 | $2,368 | $120,300 | $0 | $120,300 |
| 2017 | $2,212 | $112,500 | $0 | $112,500 |
| 2016 | $2,135 | $108,600 | $0 | $108,600 |
| 2015 | $2,061 | $104,800 | $0 | $104,800 |
Source: Public Records
About Classical High Condominiums
Map
Nearby Homes
- 40 Byers St
- 0 Maple St
- 69 Winter St
- 140 Chestnut St Unit 706
- 140 Chestnut St Unit 702
- 140 Chestnut St Unit 204
- 140 Chestnut St Unit 819
- 140 Chestnut St Unit 619
- 140 Chestnut St Unit 816
- 140 Chestnut St Unit 604
- 140 Chestnut St Unit 407
- 52 Central St Unit 504
- 50 Central St Unit 504
- 82 Central St Unit 304
- 66 Central St Unit 404
- 64 Central St Unit 403
- 68 Central St Unit 405
- 101 Oak St
- 63 Oak St
- 24 Adams St
- 235 State St Unit 315 & C22
- 235 State St Unit C22
- 235 State St Unit C21
- 235 State St Unit C20
- 235 State St Unit C19
- 235 State St Unit C18
- 235 State St Unit C17
- 235 State St Unit C16
- 235 State St Unit C15
- 235 State St Unit C14
- 235 State St Unit C13
- 235 State St Unit C12
- 235 State St Unit C11
- 235 State St Unit C10
- 235 State St Unit C9
- 235 State St Unit C8
- 235 State St Unit C7
- 235 State St Unit C6
- 235 State St Unit C5
- 235 State St Unit C4
Your Personal Tour Guide
Ask me questions while you tour the home.