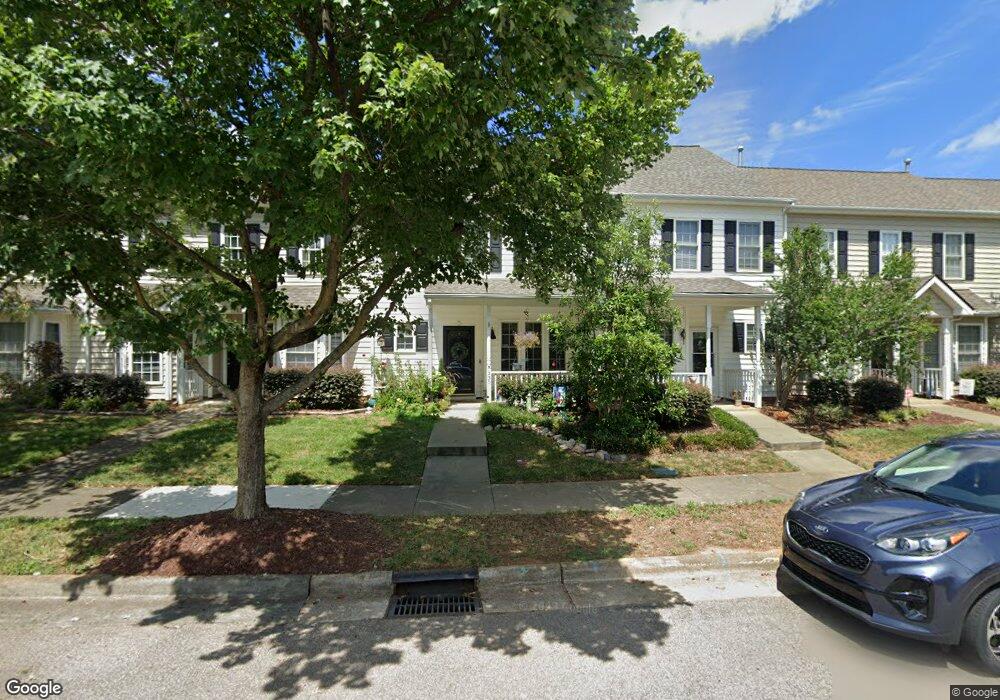
235 Sugar Maple Ave Wake Forest, NC 27587
Estimated Value: $259,000 - $289,000
3
Beds
3
Baths
1,418
Sq Ft
$193/Sq Ft
Est. Value
About This Home
This home is located at 235 Sugar Maple Ave, Wake Forest, NC 27587 and is currently estimated at $273,390, approximately $192 per square foot. 235 Sugar Maple Ave is a home located in Wake County with nearby schools including Wake Forest Elementary School, Wake Forest-Rolesville Middle School, and Wake Forest High School.
Ownership History
Date
Name
Owned For
Owner Type
Purchase Details
Closed on
Feb 10, 2015
Sold by
Gray Linda J
Bought by
Hargrove Lisa Lyn
Current Estimated Value
Home Financials for this Owner
Home Financials are based on the most recent Mortgage that was taken out on this home.
Original Mortgage
$133,536
Outstanding Balance
$102,804
Interest Rate
3.9%
Mortgage Type
FHA
Estimated Equity
$170,586
Purchase Details
Closed on
Dec 19, 2002
Sold by
Elmore Philip D
Bought by
Gray Linda J
Home Financials for this Owner
Home Financials are based on the most recent Mortgage that was taken out on this home.
Original Mortgage
$107,910
Interest Rate
8.65%
Purchase Details
Closed on
Feb 26, 2001
Sold by
Cady Construction Company Inc
Bought by
Elmore Philip D
Home Financials for this Owner
Home Financials are based on the most recent Mortgage that was taken out on this home.
Original Mortgage
$93,900
Interest Rate
7.06%
Create a Home Valuation Report for This Property
The Home Valuation Report is an in-depth analysis detailing your home's value as well as a comparison with similar homes in the area
Home Values in the Area
Average Home Value in this Area
Purchase History
| Date | Buyer | Sale Price | Title Company |
|---|---|---|---|
| Hargrove Lisa Lyn | $136,000 | None Available | |
| Gray Linda J | $120,000 | -- | |
| Elmore Philip D | $119,000 | -- |
Source: Public Records
Mortgage History
| Date | Status | Borrower | Loan Amount |
|---|---|---|---|
| Open | Hargrove Lisa Lyn | $133,536 | |
| Previous Owner | Gray Linda J | $107,910 | |
| Previous Owner | Elmore Philip D | $93,900 | |
| Closed | Gray Linda J | $5,995 |
Source: Public Records
Tax History
| Year | Tax Paid | Tax Assessment Tax Assessment Total Assessment is a certain percentage of the fair market value that is determined by local assessors to be the total taxable value of land and additions on the property. | Land | Improvement |
|---|---|---|---|---|
| 2025 | $2,747 | $286,262 | $60,000 | $226,262 |
| 2024 | $2,736 | $286,262 | $60,000 | $226,262 |
Source: Public Records
Map
Nearby Homes
- 816 Silver Linden Ln
- 233 Sugar Maple Ave
- 242 Sugar Maple Ave
- 212 Sugar Maple Ave
- 229 Yellow Poplar Ave
- 805 S Franklin St
- 605 Hyperion Aly
- 600 Callan View Ave
- 603 Brackenberry Aly
- 605 Brackenberry Aly
- 600 Brackenberry Aly
- 607 Brackenberry Aly
- 602 Brackenberry Aly
- 604 Brackenberry Aly
- 820 Laurel Gate Dr
- 606 Brackenberry Aly
- 700 Hyperion Aly
- 608 Brackenberry Aly
- 701 Callan View Ave
- 704 Hyperion Aly
- 237 Sugar Maple Ave
- 239 Sugar Maple Ave
- 231 Sugar Maple Ave
- 241 Sugar Maple Ave
- 230 Sugar Maple Ave
- 226 Sugar Maple Ave
- 228 Sugar Maple Ave
- 824 Silver Linden Ln
- 224 Sugar Maple Ave
- 240 Sugar Maple Ave
- 240 Sugar Maple Ave Unit 10
- 835 S White St
- 822 Silver Linden Ln
- unit 3 Sugar Maple Ave
- unit 2 Sugar Maple Ave
- 0 Sugar Maple Ave Unit TR1813853
- 0 Sugar Maple Ave Unit 1753467
- 238 Sugar Maple Ave
- 238 Sugar Maple Ave Unit 9
- 301 Sugar Maple Ave
Your Personal Tour Guide
Ask me questions while you tour the home.