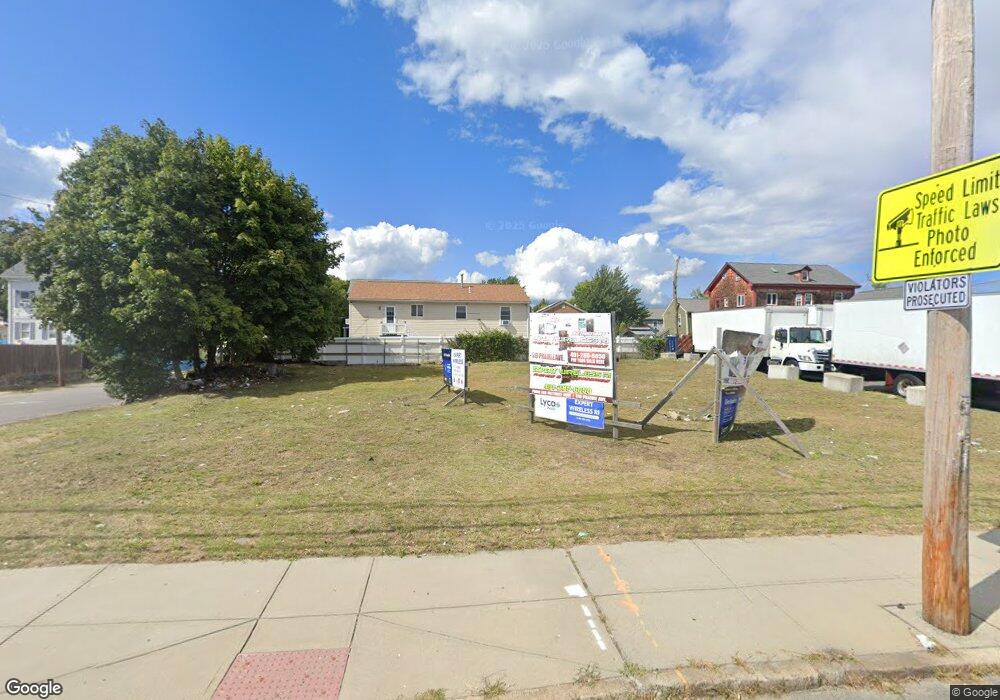
235 Thurbers Ave Providence, RI 02905
Lower South Providence NeighborhoodEstimated Value: $230,000 - $506,000
--
Bed
--
Bath
--
Sq Ft
7,841
Sq Ft Lot
About This Home
This home is located at 235 Thurbers Ave, Providence, RI 02905 and is currently estimated at $390,667. 235 Thurbers Ave is a home located in Providence County with nearby schools including Asa Messer Elementary School, Charles N. Fortes Elementary School, and Robert L. Bailey IV Elementary.
Ownership History
Date
Name
Owned For
Owner Type
Purchase Details
Closed on
Aug 2, 2024
Sold by
235 Thurbers Llc
Bought by
Ri Hsng And Mtg Fin Corp
Current Estimated Value
Purchase Details
Closed on
Feb 3, 2014
Sold by
Valelli Michael J and Parker Glenn
Bought by
Tillett Anibal A
Purchase Details
Closed on
Nov 1, 2007
Sold by
House God Chrch Attar
Bought by
Temple and Faith
Create a Home Valuation Report for This Property
The Home Valuation Report is an in-depth analysis detailing your home's value as well as a comparison with similar homes in the area
Home Values in the Area
Average Home Value in this Area
Purchase History
| Date | Buyer | Sale Price | Title Company |
|---|---|---|---|
| Ri Hsng And Mtg Fin Corp | -- | None Available | |
| Ri Hsng And Mtg Fin Corp | -- | None Available | |
| 235 Thurbers Llc | -- | None Available | |
| Tillett Anibal A | $20,000 | -- | |
| Tillett Anibal A | $20,000 | -- | |
| Temple | -- | -- | |
| Temple Prayer | -- | -- |
Source: Public Records
Mortgage History
| Date | Status | Borrower | Loan Amount |
|---|---|---|---|
| Previous Owner | Temple Prayer | $50,000 |
Source: Public Records
Tax History Compared to Growth
Tax History
| Year | Tax Paid | Tax Assessment Tax Assessment Total Assessment is a certain percentage of the fair market value that is determined by local assessors to be the total taxable value of land and additions on the property. | Land | Improvement |
|---|---|---|---|---|
| 2025 | $1,844 | $126,300 | $126,300 | $0 |
| 2024 | $1,468 | $80,000 | $80,000 | $0 |
| 2023 | $1,468 | $80,000 | $80,000 | $0 |
| 2022 | $1,424 | $80,000 | $80,000 | $0 |
| 2021 | $990 | $40,300 | $40,300 | $0 |
| 2020 | $990 | $40,300 | $40,300 | $0 |
| 2019 | $990 | $40,300 | $40,300 | $0 |
| 2018 | $1,170 | $36,600 | $36,600 | $0 |
| 2017 | $1,170 | $36,600 | $36,600 | $0 |
| 2016 | $1,170 | $36,600 | $36,600 | $0 |
| 2015 | -- | $36,600 | $36,600 | $0 |
| 2014 | $1,235 | $36,600 | $36,600 | $0 |
| 2013 | -- | $36,600 | $36,600 | $0 |
Source: Public Records
Map
Nearby Homes