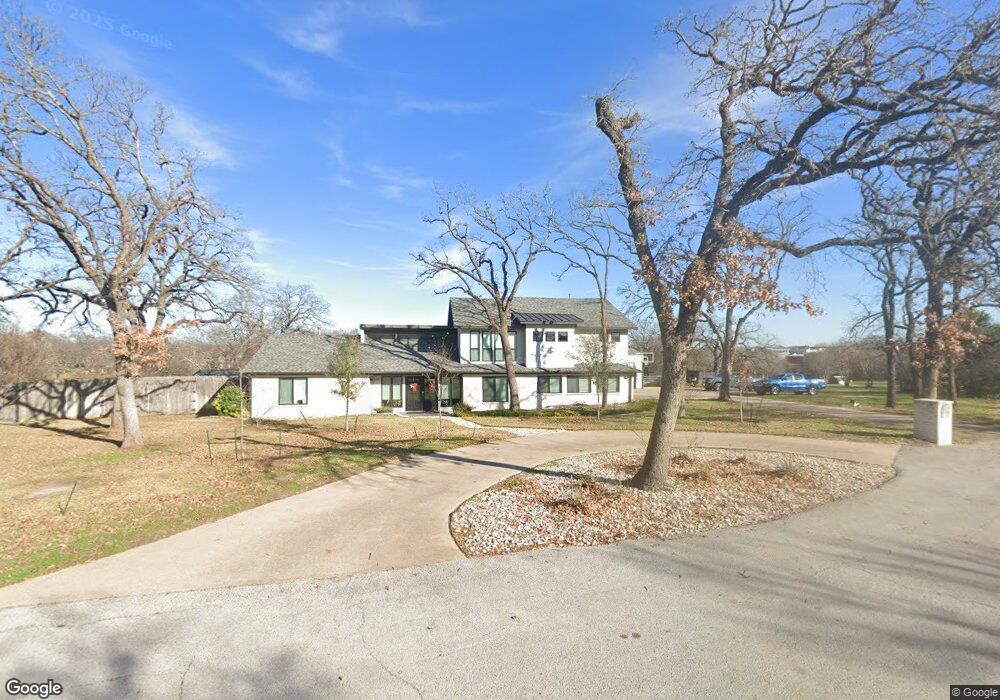
235 Timberline Ln Southlake, TX 76092
Estimated Value: $1,559,406 - $1,632,000
4
Beds
4
Baths
4,628
Sq Ft
$345/Sq Ft
Est. Value
About This Home
This home is located at 235 Timberline Ln, Southlake, TX 76092 and is currently estimated at $1,597,102, approximately $345 per square foot. 235 Timberline Ln is a home located in Tarrant County with nearby schools including Florence Elementary School, Bear Creek Intermediate School, and Keller Middle School.
Ownership History
Date
Name
Owned For
Owner Type
Purchase Details
Closed on
Sep 5, 2017
Sold by
Wymer David and Wymer Kathy
Bought by
Reed Clayton and Reed Heather
Current Estimated Value
Home Financials for this Owner
Home Financials are based on the most recent Mortgage that was taken out on this home.
Original Mortgage
$3,660,000
Outstanding Balance
$3,151,038
Interest Rate
5.12%
Mortgage Type
Adjustable Rate Mortgage/ARM
Estimated Equity
-$1,553,936
Purchase Details
Closed on
May 20, 1999
Sold by
Lee Kelly John Michael and Lee Kelly Jessica
Bought by
Wymer David and Wymer Kathy
Home Financials for this Owner
Home Financials are based on the most recent Mortgage that was taken out on this home.
Original Mortgage
$196,500
Interest Rate
6.91%
Create a Home Valuation Report for This Property
The Home Valuation Report is an in-depth analysis detailing your home's value as well as a comparison with similar homes in the area
Home Values in the Area
Average Home Value in this Area
Purchase History
| Date | Buyer | Sale Price | Title Company |
|---|---|---|---|
| Reed Clayton | -- | None Available | |
| Wymer David | -- | Safeco Land Title |
Source: Public Records
Mortgage History
| Date | Status | Borrower | Loan Amount |
|---|---|---|---|
| Open | Reed Clayton | $3,660,000 | |
| Previous Owner | Wymer David | $196,500 | |
| Closed | Wymer David | $39,300 |
Source: Public Records
Tax History Compared to Growth
Tax History
| Year | Tax Paid | Tax Assessment Tax Assessment Total Assessment is a certain percentage of the fair market value that is determined by local assessors to be the total taxable value of land and additions on the property. | Land | Improvement |
|---|---|---|---|---|
| 2025 | $13,544 | $1,332,641 | $547,100 | $785,541 |
| 2024 | $13,544 | $1,332,641 | $547,100 | $785,541 |
| 2023 | $14,611 | $1,373,022 | $547,100 | $825,922 |
| 2022 | $15,399 | $1,065,362 | $422,100 | $643,262 |
| 2021 | $15,118 | $633,000 | $422,100 | $210,900 |
| 2020 | $15,236 | $633,000 | $422,100 | $210,900 |
| 2019 | $16,151 | $633,000 | $422,100 | $210,900 |
| 2018 | $15,216 | $633,337 | $208,610 | $424,727 |
| 2017 | $14,472 | $617,973 | $362,800 | $255,173 |
| 2016 | $13,157 | $686,205 | $362,800 | $323,405 |
| 2015 | $11,677 | $458,500 | $181,400 | $277,100 |
| 2014 | $11,677 | $458,500 | $181,400 | $277,100 |
Source: Public Records
Map
Nearby Homes
- 275 Timberline Ln
- 2655 Johnson Rd
- 127 Jellico Cir
- 2304 Top Rail Ln
- 404 Branding Iron Ct
- 3095 Johnson Rd
- 205 Lovegrass Ln
- 2608 W Southlake Blvd
- 146 Jellico Cir
- 1807 Mesquite Ct
- 605 Royal Ln
- 2740 W Southlake Blvd
- 112 Stony Brook Way
- 2116 Camden Cir
- 600 Overland Trail
- 503 Indian Paintbrush Way
- 1712 Wild Rose Way
- 2525 Park Grove Loop
- 700 Overland Trail
- 2636 Park Grove Loop
- 245 Timberline Ln
- 225 Timberline Ln
- 220 Timberline Ln
- 240 Timberline Ln
- 255 Timberline Ln
- 250 Timberline Ln
- 226 Timberline Ln
- 275 Timberline Ln Unit 76092
- 2405 Johnson Rd
- 2395 Johnson Rd
- 360 Randol Mill Ave
- 270 Timberline Ln
- 2355 Johnson Rd
- 2545 Johnson Rd
- 305 Trail Dust Dr
- 2360 Johnson Rd
- 2325 Johnson Rd
- 139 Jellico Cir
- 2401 Remuda Ct
- 2530 Johnson Rd