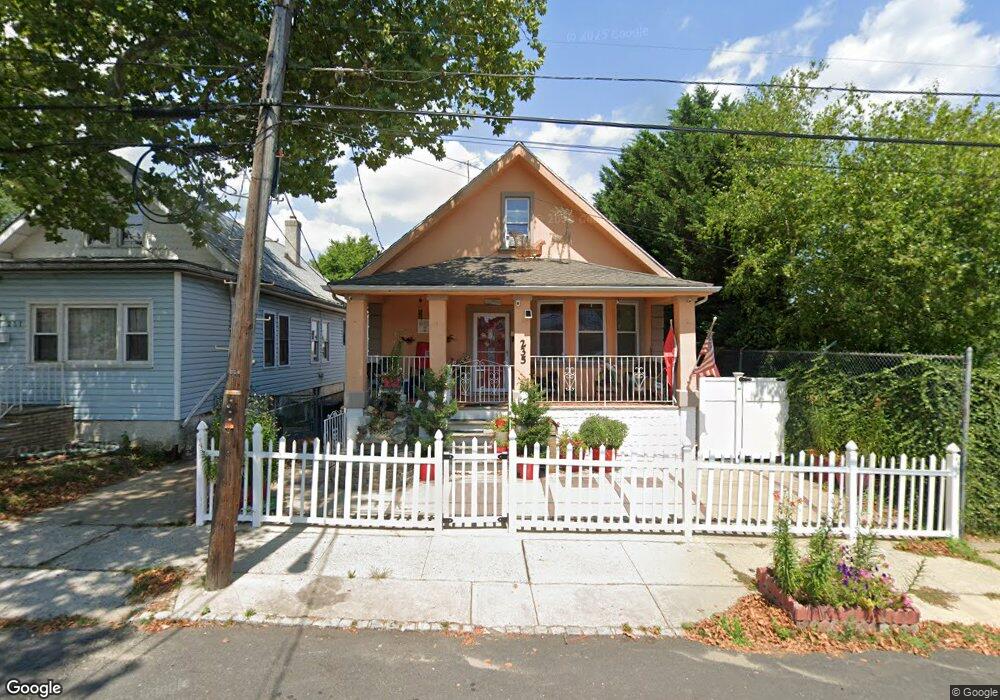
235 Van Buren St Staten Island, NY 10301
New Brighton NeighborhoodEstimated Value: $512,940 - $570,000
3
Beds
2
Baths
1,472
Sq Ft
$368/Sq Ft
Est. Value
About This Home
This home is located at 235 Van Buren St, Staten Island, NY 10301 and is currently estimated at $541,985, approximately $368 per square foot. 235 Van Buren St is a home located in Richmond County with nearby schools including P.S. 45 John Tyler, Is 61 William A Morris, and Curtis High School.
Ownership History
Date
Name
Owned For
Owner Type
Purchase Details
Closed on
Jan 18, 2017
Sold by
Wells Glenda and Baptiste Leseil
Bought by
Baptiste Leseil
Current Estimated Value
Purchase Details
Closed on
Oct 30, 2008
Sold by
Ramos Pedro
Bought by
Baptiste Leseil and Wells Glenda
Home Financials for this Owner
Home Financials are based on the most recent Mortgage that was taken out on this home.
Original Mortgage
$284,643
Outstanding Balance
$186,846
Interest Rate
6.08%
Mortgage Type
FHA
Estimated Equity
$355,139
Purchase Details
Closed on
Mar 24, 2004
Sold by
Ramos Pedro and Lopez Jose A
Bought by
Ramos Pedro
Home Financials for this Owner
Home Financials are based on the most recent Mortgage that was taken out on this home.
Original Mortgage
$214,000
Interest Rate
6.25%
Mortgage Type
New Conventional
Purchase Details
Closed on
May 22, 1998
Sold by
Welcome Home S I Ltd
Bought by
Ramos Pedro and Lopez Jose A
Home Financials for this Owner
Home Financials are based on the most recent Mortgage that was taken out on this home.
Original Mortgage
$143,650
Interest Rate
6.98%
Mortgage Type
FHA
Purchase Details
Closed on
Aug 6, 1997
Sold by
Long Island Svgs Bank Fsb
Bought by
Federal National Mortgage Association
Create a Home Valuation Report for This Property
The Home Valuation Report is an in-depth analysis detailing your home's value as well as a comparison with similar homes in the area
Home Values in the Area
Average Home Value in this Area
Purchase History
| Date | Buyer | Sale Price | Title Company |
|---|---|---|---|
| Baptiste Leseil | -- | None Available | |
| Baptiste Leseil | $288,400 | None Available | |
| Ramos Pedro | -- | Fidelity National Title Insu | |
| Ramos Pedro | $150,000 | Nations Title Insurance | |
| Federal National Mortgage Association | -- | Trw Title Insurance |
Source: Public Records
Mortgage History
| Date | Status | Borrower | Loan Amount |
|---|---|---|---|
| Open | Baptiste Leseil | $284,643 | |
| Previous Owner | Ramos Pedro | $214,000 | |
| Previous Owner | Ramos Pedro | $143,650 |
Source: Public Records
Tax History Compared to Growth
Tax History
| Year | Tax Paid | Tax Assessment Tax Assessment Total Assessment is a certain percentage of the fair market value that is determined by local assessors to be the total taxable value of land and additions on the property. | Land | Improvement |
|---|---|---|---|---|
| 2025 | $3,777 | $25,440 | $5,499 | $19,941 |
| 2024 | $3,789 | $26,640 | $4,960 | $21,680 |
| 2023 | $3,645 | $19,348 | $4,017 | $15,331 |
| 2022 | $3,575 | $28,560 | $6,540 | $22,020 |
| 2021 | $3,670 | $23,640 | $6,540 | $17,100 |
| 2020 | $3,477 | $23,040 | $6,540 | $16,500 |
| 2019 | $3,230 | $22,320 | $6,540 | $15,780 |
| 2018 | $2,989 | $16,123 | $4,483 | $11,640 |
| 2017 | $2,987 | $16,123 | $5,169 | $10,954 |
| 2016 | $2,835 | $15,733 | $5,165 | $10,568 |
| 2015 | $2,388 | $14,853 | $6,443 | $8,410 |
| 2014 | $2,388 | $14,032 | $5,538 | $8,494 |
Source: Public Records
Map
Nearby Homes
- 245 Fillmore St
- 230 Fillmore St
- 180 Fillmore St
- 177 W Buchanan St Unit 79
- 190 W Buchanan St
- 125 Tysen St
- 63 Cassidy Place
- 126 Cassidy Place Unit H2
- 141 Lafayette Ave
- 148 Clinton Ave
- 152 Clinton Ave
- 27 Eadie Place
- 16 Van Buren St
- 30 E Buchanan St
- 24-26 York Ave
- 123 Pendleton Place
- 245 Franklin Ave
- 293 Lafayette Ave
- 77 York Ave
- 93 Arnold St
- 237 Van Buren St
- 239 Van Buren St
- 730 Richmond Terrace
- 241 Van Buren St
- 732 Richmond Terrace
- 243 Van Buren St
- 232 Van Buren St
- 228 Van Buren St
- 748 Richmond Terrace
- 242 Van Buren St
- 245 Van Buren St
- 220 Van Buren St Unit 230
- 220 Van Buren St
- 220-230 Van Buren St
- 244 Van Buren St
- 251 Van Buren St
- 246 Van Buren St
- 762 Richmond Terrace
- 250 Van Buren St
- 237 Fillmore St