Estimated Value: $149,000 - $179,000
3
Beds
2
Baths
1,011
Sq Ft
$159/Sq Ft
Est. Value
About This Home
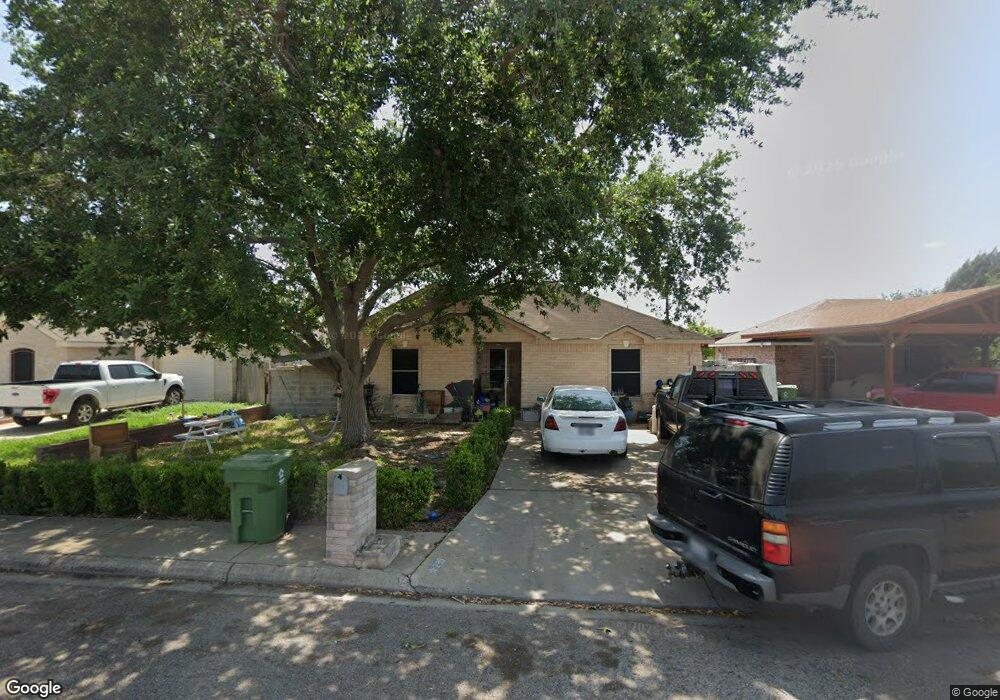
This home is located at 235 Vanilla, Alamo, TX 78516 and is currently estimated at $160,354, approximately $158 per square foot. 235 Vanilla is a home located in Hidalgo County with nearby schools including Capt. D. Salinas Elementary School, A.P. Solis Middle School, and Donna High School.
Ownership History
Date
Name
Owned For
Owner Type
Purchase Details
Closed on
Jun 5, 2018
Sold by
Vasquez Jose A and Vasquez Juana G
Bought by
Ditech Financial Llc
Current Estimated Value
Purchase Details
Closed on
Sep 12, 2005
Sold by
Landmark Valley Homes Inc
Bought by
Vasquez Jose Alonso and Vasquez Juana Gabriela
Home Financials for this Owner
Home Financials are based on the most recent Mortgage that was taken out on this home.
Original Mortgage
$66,086
Interest Rate
5.78%
Mortgage Type
Purchase Money Mortgage
Create a Home Valuation Report for This Property
The Home Valuation Report is an in-depth analysis detailing your home's value as well as a comparison with similar homes in the area
Home Values in the Area
Average Home Value in this Area
Purchase History
| Date | Buyer | Sale Price | Title Company |
|---|---|---|---|
| Ditech Financial Llc | $70,000 | None Available | |
| Vasquez Jose Alonso | -- | None Available |
Source: Public Records
Mortgage History
| Date | Status | Borrower | Loan Amount |
|---|---|---|---|
| Previous Owner | Vasquez Jose Alonso | $66,086 |
Source: Public Records
Tax History Compared to Growth
Tax History
| Year | Tax Paid | Tax Assessment Tax Assessment Total Assessment is a certain percentage of the fair market value that is determined by local assessors to be the total taxable value of land and additions on the property. | Land | Improvement |
|---|---|---|---|---|
| 2025 | $1,592 | $113,949 | -- | -- |
| 2024 | $1,592 | $103,590 | $35,989 | $67,601 |
| 2023 | $2,424 | $95,253 | $0 | $0 |
| 2022 | $2,198 | $84,376 | $0 | $0 |
| 2021 | $2,013 | $76,705 | $34,144 | $51,048 |
| 2020 | $1,890 | $69,732 | $33,682 | $47,656 |
| 2019 | $1,738 | $63,393 | $23,070 | $40,323 |
| 2018 | $1,753 | $64,351 | $23,070 | $41,281 |
| 2017 | $1,802 | $65,310 | $23,070 | $42,240 |
| 2016 | $1,720 | $62,341 | $21,224 | $41,117 |
| 2015 | $1,512 | $62,802 | $21,224 | $41,578 |
Source: Public Records
Map
Nearby Homes