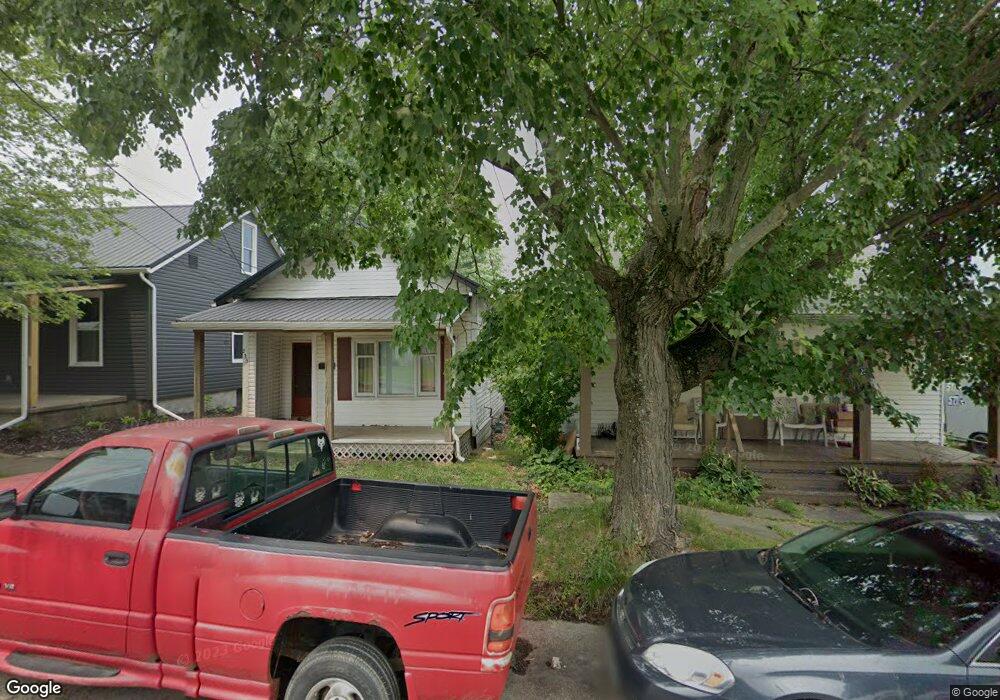
235 W South St Barnesville, OH 43713
Estimated Value: $64,468 - $122,000
1
Bed
2
Baths
714
Sq Ft
$125/Sq Ft
Est. Value
About This Home
This home is located at 235 W South St, Barnesville, OH 43713 and is currently estimated at $89,117, approximately $124 per square foot. 235 W South St is a home located in Belmont County with nearby schools including Barnesville Elementary School, Barnesville Middle School, and Barnesville High School.
Ownership History
Date
Name
Owned For
Owner Type
Purchase Details
Closed on
Feb 4, 2017
Sold by
Crawford William H and Crawford Barbara J
Bought by
Greenwood Tina M and Greenwood Robert A
Current Estimated Value
Purchase Details
Closed on
May 11, 2012
Sold by
Hannahs Michelle
Bought by
Crawford William H
Purchase Details
Closed on
Mar 12, 2003
Sold by
Hannahs Samuel O
Bought by
Hannahs Samuel O
Purchase Details
Closed on
Jan 1, 1986
Sold by
Hannahs Lena
Bought by
Hannahs Lena
Create a Home Valuation Report for This Property
The Home Valuation Report is an in-depth analysis detailing your home's value as well as a comparison with similar homes in the area
Home Values in the Area
Average Home Value in this Area
Purchase History
| Date | Buyer | Sale Price | Title Company |
|---|---|---|---|
| Greenwood Tina M | -- | Attorney | |
| Crawford William H | -- | Attorney | |
| Hannahs Samuel O | -- | -- | |
| Hannahs Lena | -- | -- |
Source: Public Records
Tax History Compared to Growth
Tax History
| Year | Tax Paid | Tax Assessment Tax Assessment Total Assessment is a certain percentage of the fair market value that is determined by local assessors to be the total taxable value of land and additions on the property. | Land | Improvement |
|---|---|---|---|---|
| 2024 | $128 | $3,800 | $1,280 | $2,520 |
| 2023 | $331 | $9,540 | $1,130 | $8,410 |
| 2022 | $331 | $9,544 | $1,134 | $8,410 |
| 2021 | $332 | $9,544 | $1,134 | $8,410 |
| 2020 | $290 | $7,960 | $950 | $7,010 |
| 2019 | $292 | $7,960 | $950 | $7,010 |
| 2018 | $220 | $7,960 | $950 | $7,010 |
| 2017 | $149 | $3,930 | $920 | $3,010 |
| 2016 | $171 | $4,700 | $920 | $3,780 |
| 2015 | $170 | $4,700 | $920 | $3,780 |
| 2014 | $209 | $5,690 | $840 | $4,850 |
| 2013 | $200 | $5,690 | $840 | $4,850 |
Source: Public Records
Map
Nearby Homes
- 423 W Main St
- 410 N Chestnut St
- 136 E Walnut St
- 318 Hunts Ave
- 502 W Main St
- 143 Cherry St
- 519 W Main St
- 406 S Chestnut St
- 311 Washington St
- TBD W Main St
- 323 S Lincoln Ave
- 333 Mulberry St
- 501 E Main St
- 215 Railroad St
- 613 E Main St
- 145 Kennard Ave
- 105 Bethesda St
- 61900 Fairview Rd
- 62239 Hillcrest Rd
- 118 Pine Ln
- 233 W South St
- 239 W South St
- 241 W South St
- 229 W South St
- 225 W South St
- 260 W Main St
- 252 W Main St
- 221 W South St Unit rear
- 248 W Main St
- 223 W South St
- 223 W South St
- 307 W South St
- 242 W Main St
- 242 W South St
- 230 W South St
- 309 W South St
- 226 W South St
- 211 1/2 W South St
- 311 W South St
- 220 W South St