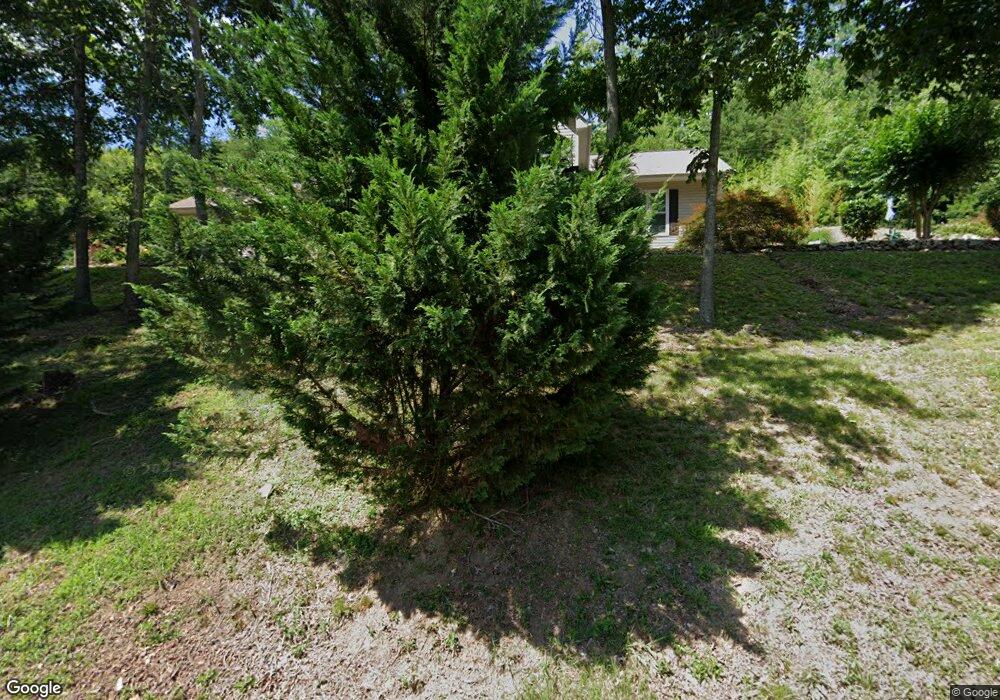
235 Whispering Pines Dr Trenton, GA 30752
Estimated Value: $388,000 - $413,000
3
Beds
2
Baths
2,322
Sq Ft
$171/Sq Ft
Est. Value
About This Home
This home is located at 235 Whispering Pines Dr, Trenton, GA 30752 and is currently estimated at $396,945, approximately $170 per square foot. 235 Whispering Pines Dr is a home located in Dade County with nearby schools including Dade Middle School and Dade County High School.
Ownership History
Date
Name
Owned For
Owner Type
Purchase Details
Closed on
Sep 1, 2023
Sold by
Robertson Margaret C
Bought by
Trevor Jonathan and Trevor Stephanie
Current Estimated Value
Home Financials for this Owner
Home Financials are based on the most recent Mortgage that was taken out on this home.
Original Mortgage
$297,500
Outstanding Balance
$291,190
Interest Rate
6.96%
Mortgage Type
New Conventional
Estimated Equity
$105,755
Purchase Details
Closed on
Mar 28, 2006
Sold by
First Bank Of Tennessee
Bought by
Robertson Robert B
Purchase Details
Closed on
Apr 5, 2005
Sold by
Valleyview Dev Llc
Bought by
First Bank Of Tennessee
Purchase Details
Closed on
Aug 3, 1999
Sold by
Yoshihiro Sugita And
Bought by
Valleyview Dev Llc
Purchase Details
Closed on
Jul 2, 1997
Sold by
Lindstone Vincent
Bought by
Yoshihiro Sugita And
Purchase Details
Closed on
Sep 21, 1995
Sold by
James Helms
Bought by
Lidstone Vincent And
Create a Home Valuation Report for This Property
The Home Valuation Report is an in-depth analysis detailing your home's value as well as a comparison with similar homes in the area
Home Values in the Area
Average Home Value in this Area
Purchase History
| Date | Buyer | Sale Price | Title Company |
|---|---|---|---|
| Trevor Jonathan | $350,000 | -- | |
| Robertson Robert B | $33,000 | -- | |
| First Bank Of Tennessee | -- | -- | |
| Valleyview Dev Llc | $20,000 | -- | |
| Yoshihiro Sugita And | $12,500 | -- | |
| Lidstone Vincent And | $10,900 | -- |
Source: Public Records
Mortgage History
| Date | Status | Borrower | Loan Amount |
|---|---|---|---|
| Open | Trevor Jonathan | $297,500 |
Source: Public Records
Tax History Compared to Growth
Tax History
| Year | Tax Paid | Tax Assessment Tax Assessment Total Assessment is a certain percentage of the fair market value that is determined by local assessors to be the total taxable value of land and additions on the property. | Land | Improvement |
|---|---|---|---|---|
| 2024 | $2,812 | $127,800 | $17,400 | $110,400 |
| 2023 | $2,785 | $124,400 | $17,400 | $107,000 |
| 2022 | $588 | $108,200 | $17,400 | $90,800 |
| 2021 | $585 | $88,520 | $8,040 | $80,480 |
| 2020 | $590 | $83,200 | $6,080 | $77,120 |
| 2019 | $605 | $84,320 | $6,080 | $78,240 |
| 2018 | $2,023 | $84,320 | $6,080 | $78,240 |
| 2017 | $620 | $71,600 | $6,080 | $65,520 |
| 2016 | $1,654 | $71,200 | $6,080 | $65,120 |
| 2015 | $1,321 | $58,560 | $6,080 | $52,480 |
| 2014 | -- | $54,236 | $7,320 | $46,916 |
| 2013 | -- | $72,760 | $11,280 | $61,480 |
Source: Public Records
Map
Nearby Homes
- 54 Whispering Pines Dr
- 0 Northwoods Ln Unit 1521613
- 165 N Woods Ln
- 553 Back Valley Rd
- 1150 Back Valley Rd
- 11080 U S 11
- 000 W Ga 136 Hwy
- 134 Melissa Dr
- 204 Melissa Dr
- 493 Bernice Dr
- 738 Sells Ln
- 535 Castle Dr
- 272 Cloud Rd
- 0 Georgia 136
- 403 Lyman Daniel Rd
- 292 District Line Rd
- 1145 Daniels Rd
- 102 Sunset Dr
- 0 Woodmont Place Unit 1504974
- 329 Glenview Dr
- 235 Whispering Pine
- 0 Whispering Pine
- 353 Whispering Pines Dr
- 296 Whispering Pines Dr
- 10 Tanglewood Trail
- 10 Tanglewood Trail
- 120 Tanglewood Trail
- 120 Tanglewood Tr
- 421 Whispering Pines Dr
- 260 Tanglewood Trail
- 18 Lake Dr
- Lot #13 Northwoods Ln
- 5 Northwood Ln
- 107 Lake Dr
- 0 Lake Dr
- 0 Lake Dr Unit 1029389
- 0 Lake Dr Unit 1286156
- 0 Lake Dr Unit 1213906
- 0 Lake Dr Unit RTC2727683
- 0 Lake Dr Unit 1179606