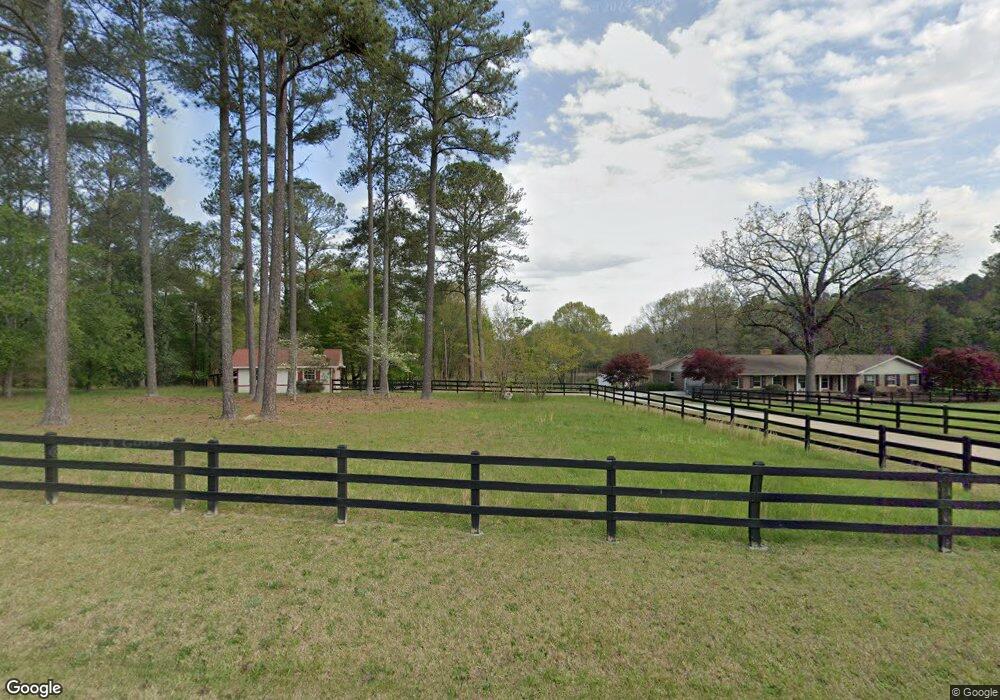
235 Yarbrough Rd Unit A Aragon, GA 30104
Estimated Value: $240,000 - $420,000
4
Beds
3
Baths
3,039
Sq Ft
$104/Sq Ft
Est. Value
About This Home
This home is located at 235 Yarbrough Rd Unit A, Aragon, GA 30104 and is currently estimated at $316,142, approximately $104 per square foot. 235 Yarbrough Rd Unit A is a home located in Polk County with nearby schools including Rockmart Middle School.
Ownership History
Date
Name
Owned For
Owner Type
Purchase Details
Closed on
Nov 16, 2016
Sold by
Christopher S
Bought by
Miller Christopher S and Miller Kristen G
Current Estimated Value
Purchase Details
Closed on
Nov 30, 2015
Sold by
Gillespie Wayne
Bought by
Miller Christopher S and Miller Kristen G
Purchase Details
Closed on
Jun 22, 1998
Sold by
Spears David E and Spears Connie M
Bought by
Busch Russell S and Busch Melissa L
Purchase Details
Closed on
Aug 23, 1983
Sold by
Mcdurmon Jerry W
Bought by
Spears David E
Purchase Details
Closed on
Aug 30, 1979
Sold by
Tilley Phillip R
Bought by
Mcdurmon Jerry W
Purchase Details
Closed on
Apr 19, 1973
Sold by
Spinks Hugh and Spinks Jones
Bought by
Tilley Phillip R
Purchase Details
Closed on
Apr 8, 1972
Sold by
White Ralph
Bought by
Spinks Hugh
Purchase Details
Closed on
Oct 27, 1964
Sold by
Mccollum J J
Bought by
White Ralph
Purchase Details
Closed on
Aug 20, 1912
Bought by
Mccollum J J
Create a Home Valuation Report for This Property
The Home Valuation Report is an in-depth analysis detailing your home's value as well as a comparison with similar homes in the area
Home Values in the Area
Average Home Value in this Area
Purchase History
| Date | Buyer | Sale Price | Title Company |
|---|---|---|---|
| Miller Christopher S | -- | -- | |
| Miller Christopher S | -- | -- | |
| Busch Russell S | $240,000 | -- | |
| Spears David E | -- | -- | |
| Mcdurmon Jerry W | -- | -- | |
| Tilley Phillip R | -- | -- | |
| Spinks Hugh | -- | -- | |
| White Ralph | -- | -- | |
| Mccollum J J | -- | -- |
Source: Public Records
Tax History Compared to Growth
Tax History
| Year | Tax Paid | Tax Assessment Tax Assessment Total Assessment is a certain percentage of the fair market value that is determined by local assessors to be the total taxable value of land and additions on the property. | Land | Improvement |
|---|---|---|---|---|
| 2024 | $1,037 | $49,618 | $38,104 | $11,514 |
| 2023 | $1,086 | $45,776 | $38,104 | $7,672 |
| 2022 | $762 | $32,112 | $25,402 | $6,710 |
| 2021 | $772 | $32,112 | $25,402 | $6,710 |
| 2020 | $774 | $32,112 | $25,402 | $6,710 |
| 2019 | $761 | $28,345 | $25,402 | $2,943 |
| 2018 | $778 | $28,247 | $25,402 | $2,845 |
| 2017 | $769 | $28,247 | $25,402 | $2,845 |
| 2016 | $184 | $6,761 | $6,761 | $0 |
| 2015 | $571 | $20,926 | $20,926 | $0 |
| 2014 | $575 | $20,926 | $20,926 | $0 |
| 2013 | -- | $83,674 | $30,794 | $52,880 |
Source: Public Records
Map
Nearby Homes
- 0 Hwy 101 and Dean Rd Unit 10620814
- 4526 Rome Hwy
- 6792 Rockmart Rd SE
- 231 Gordon Rd
- 1424 Harmony Rd SE
- 1111 Old Collard Valley Rd
- 838 Pleasant Hope Rd SE
- 34 Hudson Loop Rd
- 0 Stewart Rd
- 565 Raiford Rd
- 330 Flint Hill Rd
- 463 Compton Rd SE
- 180 Flint Hill Rd
- 150 Pleasant Hope Rd SE
- 320 Brumbelow Rd
- 1104 Burkhalter Rd SE
- 2557 Wax Rd SE
- 235 Yarbrough Rd Unit B
- 235 Yarbrough Rd
- 101 Yarbrough Rd
- 165 Yarbrough Rd
- 185 Yarbrough Rd
- 265 Yarbrough Rd
- 341 Yarbrough Rd
- 59 Yarbrough Rd
- 190 Yarbrough Rd
- 55 Yarbrough Rd
- 118 Yarbrough Rd
- 321 Yarbrough Rd
- 300 Yarbrough Rd
- 320 Yarbrough Rd
- 394 Dean Rd
- 21 Yarbrough Rd
- 5025 Rome Hwy
- 0 Yarbrough Rd
- 00 Yarbrough Rd
- 0 Yarbrough Rd Unit 7556565