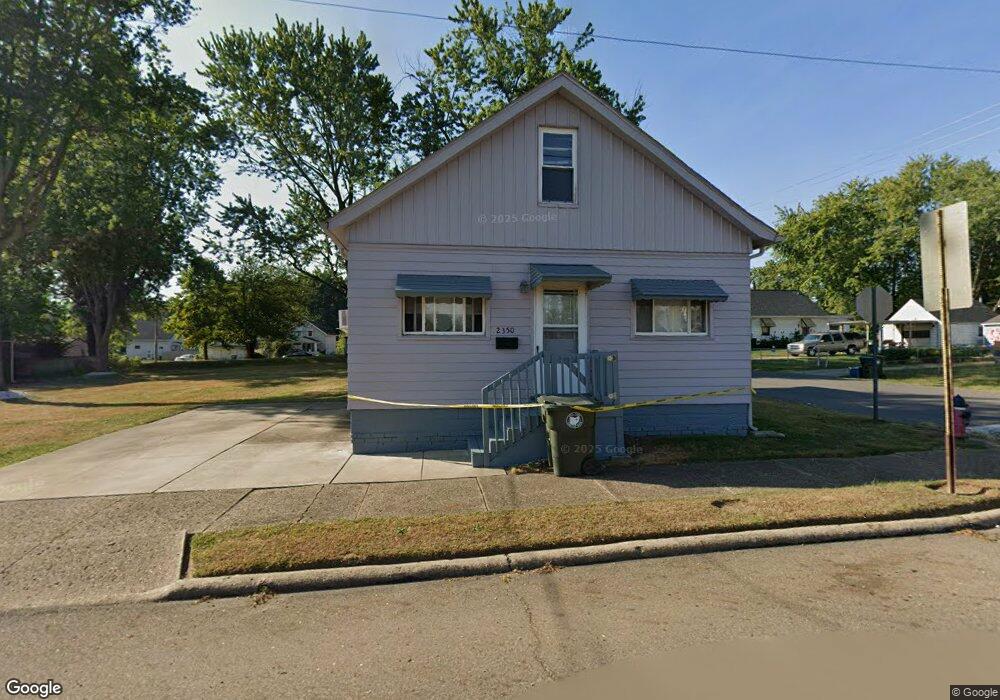
2350 17th St SW Canton, OH 44706
Estimated Value: $92,028 - $140,000
2
Beds
2
Baths
1,902
Sq Ft
$60/Sq Ft
Est. Value
About This Home
This home is located at 2350 17th St SW, Canton, OH 44706 and is currently estimated at $114,257, approximately $60 per square foot. 2350 17th St SW is a home located in Stark County with nearby schools including Early Learning Center @ Schreiber, Cedar Elementary School, and McGregor Elementary School.
Ownership History
Date
Name
Owned For
Owner Type
Purchase Details
Closed on
Nov 19, 2008
Sold by
Us Bank Na
Bought by
Allison Harold N and Allison Barbara C
Current Estimated Value
Purchase Details
Closed on
Sep 29, 2008
Sold by
Welch John C and Welch Nancy R
Bought by
Us Bank Na
Purchase Details
Closed on
Mar 28, 2002
Sold by
Crum Clarence F and Crum Marisa A
Bought by
Welch John C and Welch Nancy R
Home Financials for this Owner
Home Financials are based on the most recent Mortgage that was taken out on this home.
Original Mortgage
$51,750
Interest Rate
6.93%
Purchase Details
Closed on
Feb 16, 1999
Sold by
Elsass Douglas A and Elsass Debra J
Bought by
Crum Clarence F and Crum Marisa A
Purchase Details
Closed on
Feb 11, 1999
Sold by
Mcpherson William M and Mcpherson Marilyn A
Bought by
Ruth John L and Ruth Mary
Purchase Details
Closed on
Feb 10, 1999
Sold by
Ruth John L and Ruth Mary
Bought by
Elsass Douglas A and Elsass Debra J
Create a Home Valuation Report for This Property
The Home Valuation Report is an in-depth analysis detailing your home's value as well as a comparison with similar homes in the area
Purchase History
| Date | Buyer | Sale Price | Title Company |
|---|---|---|---|
| Allison Harold N | $17,000 | Titlequest Agency Inc | |
| Us Bank Na | $44,000 | None Available | |
| Welch John C | $69,000 | Quest Title Agency Inc | |
| Crum Clarence F | -- | -- | |
| Ruth John L | -- | -- | |
| Elsass Douglas A | -- | -- | |
| Ruth John L | -- | -- |
Source: Public Records
Mortgage History
| Date | Status | Borrower | Loan Amount |
|---|---|---|---|
| Previous Owner | Welch John C | $51,750 | |
| Closed | Welch John C | $13,800 |
Source: Public Records
Tax History
| Year | Tax Paid | Tax Assessment Tax Assessment Total Assessment is a certain percentage of the fair market value that is determined by local assessors to be the total taxable value of land and additions on the property. | Land | Improvement |
|---|---|---|---|---|
| 2025 | -- | $28,920 | $3,890 | $25,030 |
| 2024 | -- | $28,920 | $3,890 | $25,030 |
| 2023 | $927 | $15,230 | $2,770 | $12,460 |
| 2022 | $901 | $15,230 | $2,770 | $12,460 |
| 2021 | $910 | $15,230 | $2,770 | $12,460 |
| 2020 | $867 | $12,990 | $2,380 | $10,610 |
| 2019 | $759 | $12,990 | $2,380 | $10,610 |
Source: Public Records
Map
Nearby Homes
- 1640 Bedford Ave SW
- 1653 Bedford Ave SW
- 1624 Tanner Ave SW
- 0 20th St SW
- 1600 Sandwith Ave SW
- 2022 Tanner Ave SW
- 0 Harrison Ave SW
- 1700 Clark Ave SW
- 1721 Hammond Ave SW
- 1252 Dartmouth Ave SW
- 1241 Bedford Ave SW
- 1248 Dartmouth Ave SW
- 1529 Stark Ave SW
- 1425 Crescent Rd SW
- 1372 Maryland Ave SW
- 1379 Maryland Ave SW
- 3204 14th St SW
- 1227 Greenfield Ave SW
- 2423 12th St SW
- 1136 Smith Ave SW
- 2402 17th St SW
- 2336 17th St SW
- 1716 Alden Ave SW
- 1713 Alden Ave SW
- 1713 Alden Ave SW
- 1715 Vine Ave SW
- 1663 Alden Ave SW
- 1717 Vine Ave SW
- 1717 Alden Ave SW
- 1701 Vine Ave SW
- 2412 17th St SW
- 2412 17th St SW
- 1659 Alden Ave SW
- 1651 Alden Ave SW
- 0 Alden Ave SW
- 2342 18th St SW
- 1712 Bedford Ave SW
- 2413 17th St SW
- 1720 Bedford Ave SW
- 2400 18th St SW
Your Personal Tour Guide
Ask me questions while you tour the home.