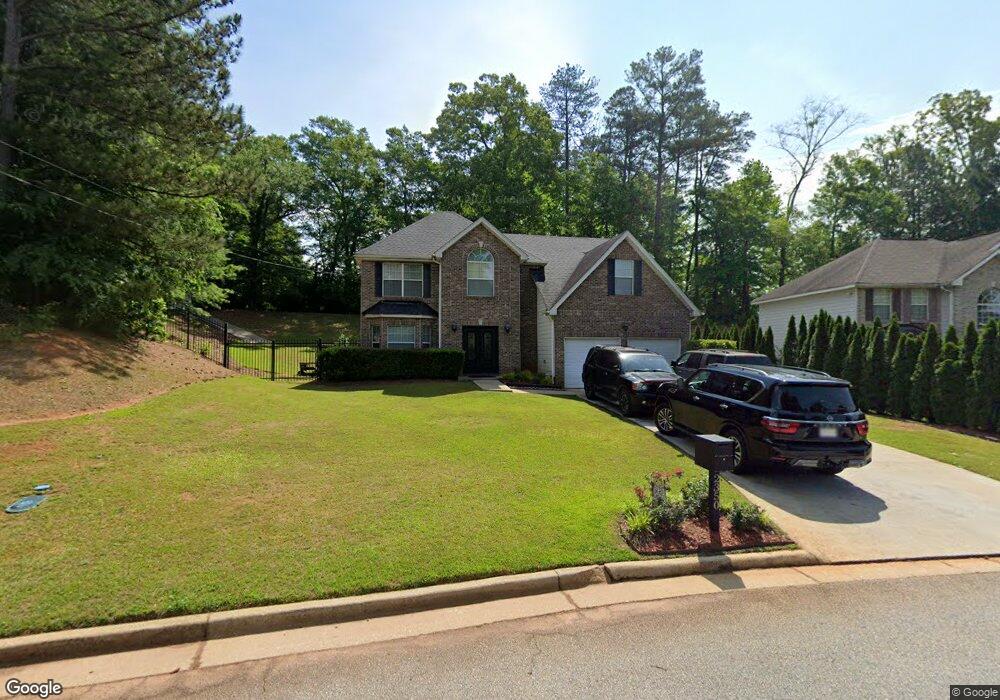
2350 Marsh Rabbit Ln Decatur, GA 30035
Southwest DeKalb NeighborhoodEstimated Value: $244,000 - $359,000
4
Beds
3
Baths
2,460
Sq Ft
$129/Sq Ft
Est. Value
About This Home
This home is located at 2350 Marsh Rabbit Ln, Decatur, GA 30035 and is currently estimated at $316,512, approximately $128 per square foot. 2350 Marsh Rabbit Ln is a home located in DeKalb County with nearby schools including Canby Lane Elementary School, Mary McLeod Bethune Middle School, and Towers High School.
Ownership History
Date
Name
Owned For
Owner Type
Purchase Details
Closed on
Aug 3, 2010
Sold by
Bank Of America
Bought by
Secretary Of Veterans Affairs
Current Estimated Value
Purchase Details
Closed on
Apr 7, 2009
Sold by
Bank Of America Na
Bought by
Secretary Of Veterans Affairs
Purchase Details
Closed on
Jun 30, 2004
Sold by
Legacy Communities Of Hairston Frst
Bought by
Williams Theresa D
Home Financials for this Owner
Home Financials are based on the most recent Mortgage that was taken out on this home.
Original Mortgage
$183,112
Interest Rate
6.24%
Mortgage Type
VA
Purchase Details
Closed on
Dec 23, 2003
Sold by
South Hairston Gp Llc
Bought by
Legacy Comm Of Hairston Forrest
Home Financials for this Owner
Home Financials are based on the most recent Mortgage that was taken out on this home.
Original Mortgage
$130,000
Interest Rate
5.77%
Create a Home Valuation Report for This Property
The Home Valuation Report is an in-depth analysis detailing your home's value as well as a comparison with similar homes in the area
Home Values in the Area
Average Home Value in this Area
Purchase History
| Date | Buyer | Sale Price | Title Company |
|---|---|---|---|
| Secretary Of Veterans Affairs | -- | -- | |
| Bank Of America | $110,162 | -- | |
| Secretary Of Veterans Affairs | -- | -- | |
| Bank Of America Na | $118,975 | -- | |
| Williams Theresa D | $183,200 | -- | |
| Legacy Comm Of Hairston Forrest | $40,000 | -- |
Source: Public Records
Mortgage History
| Date | Status | Borrower | Loan Amount |
|---|---|---|---|
| Previous Owner | Williams Theresa D | $183,112 | |
| Previous Owner | Legacy Comm Of Hairston Forrest | $130,000 |
Source: Public Records
Tax History Compared to Growth
Tax History
| Year | Tax Paid | Tax Assessment Tax Assessment Total Assessment is a certain percentage of the fair market value that is determined by local assessors to be the total taxable value of land and additions on the property. | Land | Improvement |
|---|---|---|---|---|
| 2025 | $3,125 | $119,640 | $15,553 | $104,087 |
| 2024 | $3,161 | $119,640 | $15,553 | $104,087 |
| 2023 | $3,161 | $119,640 | $15,840 | $103,800 |
| 2022 | $2,670 | $101,720 | $9,920 | $91,800 |
| 2021 | $2,233 | $82,760 | $9,920 | $72,840 |
| 2020 | $2,053 | $74,760 | $9,920 | $64,840 |
| 2019 | $2,033 | $74,280 | $9,920 | $64,360 |
| 2018 | $1,624 | $62,640 | $9,920 | $52,720 |
| 2017 | $1,473 | $48,640 | $8,269 | $40,371 |
| 2016 | $1,451 | $48,640 | $8,269 | $40,371 |
| 2014 | $1,183 | $36,960 | $8,240 | $28,720 |
Source: Public Records
Map
Nearby Homes
- 4579 Tudor Castle Dr
- 2065 Resting Creek Dr
- 2428 Marsh Rabbit Bend
- 4827 Snap Creek Ln
- 5181 Covington Hwy
- 5169 Covington Hwy
- 5159 Covington Hwy
- 4373 Buckingham Cir
- 2360 S Hairston Rd
- 2183 Ramblewood Cir
- 4421 John Wesley Dr
- 4612 Grand Central Pkwy
- 2109 Creekview Trail
- 5160 Covington Hwy Unit 18
- 5160 Covington Hwy
- 4783 Creekside Place
- 1830 Broadway St
- 4839 Plymouth Trace Unit 2
- 2014 Manhattan Pkwy
- 2087 John Wesley Ct
- 2354 Marsh Rabbit Ln
- 2100 S Hairston Rd
- 2358 Marsh Rabbit Ln
- 2355 Marsh Rabbit Ln
- 2345 Marsh Rabbit Ln
- 2505 Waters Run
- 2499 Waters Run
- 2133 Eagles Nest Cir
- 2137 Eagles Nest Cir
- 2362 Marsh Rabbit Ln
- 2341 Eagles Nest Cir
- 2493 Waters Run Unit 2
- 4940 Marsh Rabbit Cove
- 2141 Eagles Nest Cir
- 4648 Redbranch Dr Unit 2
- 4642 Redbranch Dr
- 4934 Marsh Rabbit Cove Unit 1
- 2366 Marsh Rabbit Ln
- 2337 Eagles Nest Cir