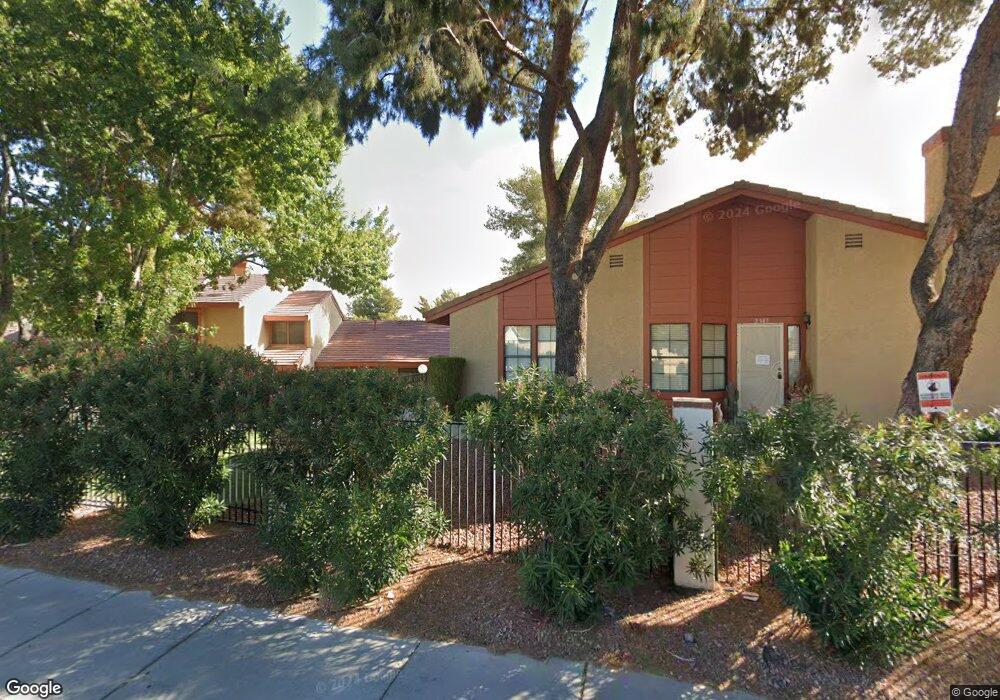
2350 Pickwick Dr Henderson, NV 89014
Green Valley North NeighborhoodEstimated Value: $313,000 - $332,000
2
Beds
3
Baths
1,519
Sq Ft
$212/Sq Ft
Est. Value
About This Home
This home is located at 2350 Pickwick Dr, Henderson, NV 89014 and is currently estimated at $322,511, approximately $212 per square foot. 2350 Pickwick Dr is a home located in Clark County with nearby schools including Estes M Mcdoniel Elementary School, Barbara and Hank Greenspun Junior High School, and Green Valley High School.
Ownership History
Date
Name
Owned For
Owner Type
Purchase Details
Closed on
May 1, 2023
Sold by
Beckham Tai Fraye
Bought by
Champlin Margaret K
Current Estimated Value
Purchase Details
Closed on
Apr 24, 2023
Sold by
Champlin Margaret K
Bought by
Forrest K K Lum Trust
Purchase Details
Closed on
May 10, 2021
Sold by
Marks Gerald
Bought by
Champlin Margaret K
Home Financials for this Owner
Home Financials are based on the most recent Mortgage that was taken out on this home.
Original Mortgage
$247,350
Interest Rate
3.1%
Mortgage Type
New Conventional
Purchase Details
Closed on
Aug 22, 2016
Sold by
Murphy Patricia J and Murphy Penny E
Bought by
Marald Gerald
Home Financials for this Owner
Home Financials are based on the most recent Mortgage that was taken out on this home.
Original Mortgage
$82,400
Interest Rate
3.45%
Mortgage Type
New Conventional
Purchase Details
Closed on
Feb 7, 1997
Sold by
Murphy George C
Bought by
Murphy Patrick J and Murphy Penny E
Create a Home Valuation Report for This Property
The Home Valuation Report is an in-depth analysis detailing your home's value as well as a comparison with similar homes in the area
Home Values in the Area
Average Home Value in this Area
Purchase History
| Date | Buyer | Sale Price | Title Company |
|---|---|---|---|
| Champlin Margaret K | -- | Roc Title | |
| Forrest K K Lum Trust | $320,000 | Roc Title | |
| Champlin Margaret K | $255,000 | Roc Title | |
| Marald Gerald | $103,000 | Equity Title Of Nevada | |
| Murphy Patrick J | $101,000 | -- |
Source: Public Records
Mortgage History
| Date | Status | Borrower | Loan Amount |
|---|---|---|---|
| Previous Owner | Champlin Margaret K | $247,350 | |
| Previous Owner | Marald Gerald | $82,400 |
Source: Public Records
Tax History
| Year | Tax Paid | Tax Assessment Tax Assessment Total Assessment is a certain percentage of the fair market value that is determined by local assessors to be the total taxable value of land and additions on the property. | Land | Improvement |
|---|---|---|---|---|
| 2026 | $1,128 | $64,872 | $25,900 | $38,972 |
| 2025 | $1,045 | $65,324 | $25,900 | $39,424 |
| 2024 | $968 | $65,324 | $25,900 | $39,424 |
| 2023 | $968 | $59,492 | $22,750 | $36,742 |
| 2022 | $896 | $54,667 | $19,460 | $35,207 |
| 2021 | $910 | $46,609 | $17,500 | $29,109 |
| 2020 | $842 | $46,049 | $15,400 | $30,649 |
| 2019 | $832 | $42,934 | $12,250 | $30,684 |
| 2018 | $794 | $40,462 | $10,850 | $29,612 |
| 2017 | $1,140 | $38,817 | $9,450 | $29,367 |
| 2016 | $744 | $38,018 | $7,700 | $30,318 |
| 2015 | $742 | $31,887 | $5,250 | $26,637 |
| 2014 | $719 | $23,557 | $5,425 | $18,132 |
Source: Public Records
Map
Nearby Homes
- 2347 Pickwick Dr
- 2349 Pickwick Dr Unit 91
- 2367 Pickwick Dr
- 2379 Pickwick Dr
- 2415 Pickwick Dr Unit 50
- 2446 Pickwick Dr
- 2403 Bonita Ln Unit 1
- 3135 La Mesa Dr
- 2423 Vista Colina St
- 3115 La Mancha Way
- 3102 La Mancha Way
- 2812 Bluegill Way Unit A
- 3158 La Luna Cir
- 1911 Bluegill Way Unit D
- 2520 Kilmaron Cir
- 2814 La Mesa Dr
- 3193 La Mancha Way
- 3185 La Mancha Way
- 2817 High View Dr
- 3205 La Mancha Way
- 2354 Pickwick Dr
- 2356 Pickwick Dr Unit 83
- 2356 Pickwick Dr
- 2370 Pickwick Dr Unit 76
- 2361 Pickwick Dr
- 2361 Pickwick Dr Unit 90
- 2358 Pickwick Dr
- 2372 Pickwick Dr
- 2368 Pickwick Dr
- 2348 Pickwick Dr
- 2348 Pickwick Dr Unit 100
- 2366 Pickwick Dr
- 2344 Pickwick Dr
- 2363 Pickwick Dr Unit n/a
- 2363 Pickwick Dr
- 2346 Pickwick Dr Unit 101
- 2364 Pickwick Dr
- 2365 Pickwick Dr
- 2342 Pickwick Dr
- 2340 Pickwick Dr
Your Personal Tour Guide
Ask me questions while you tour the home.