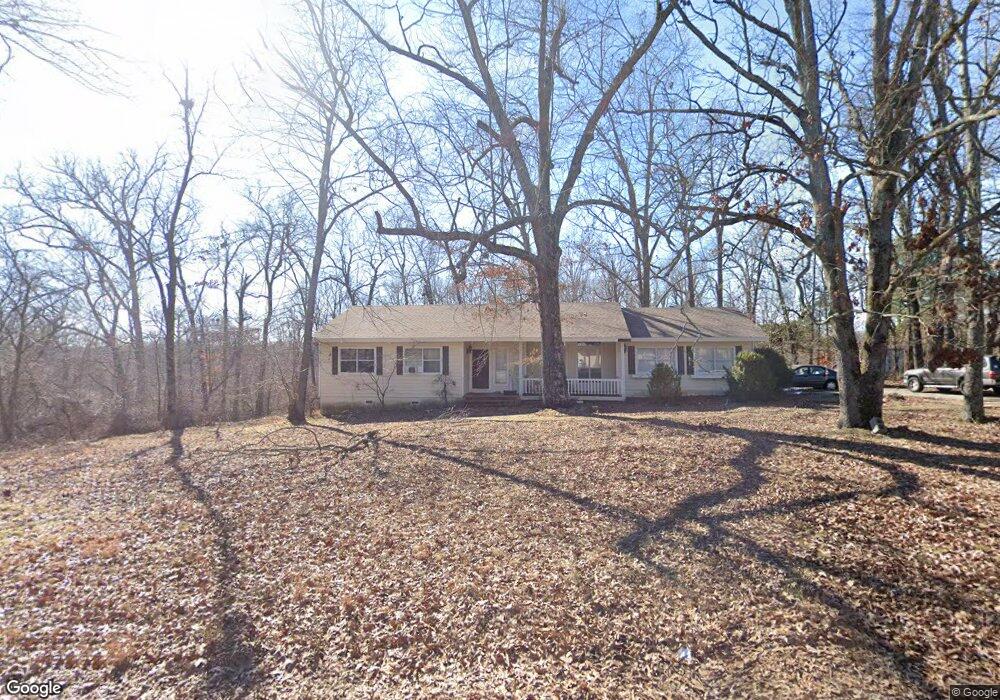
2350 Sequoyah Dr Rogers, AR 72758
Estimated Value: $299,736 - $366,000
3
Beds
2
Baths
1,565
Sq Ft
$220/Sq Ft
Est. Value
About This Home
This home is located at 2350 Sequoyah Dr, Rogers, AR 72758 and is currently estimated at $344,184, approximately $219 per square foot. 2350 Sequoyah Dr is a home located in Benton County with nearby schools including Jones Elementary School, Kirksey Middle School, and Rogers High School.
Ownership History
Date
Name
Owned For
Owner Type
Purchase Details
Closed on
Sep 28, 2009
Sold by
Fraker Cheryl and Gudbaur Robynn
Bought by
Munoz Manuel
Current Estimated Value
Home Financials for this Owner
Home Financials are based on the most recent Mortgage that was taken out on this home.
Original Mortgage
$139,918
Outstanding Balance
$91,366
Interest Rate
5.16%
Mortgage Type
FHA
Estimated Equity
$252,818
Purchase Details
Closed on
Oct 30, 2007
Sold by
Federal National Mortgage Association
Bought by
Fraker Cheryl and Gudbaur Robynn
Purchase Details
Closed on
Apr 26, 2005
Sold by
Union Planters Bank Na
Bought by
Federal National Mortgage Association
Purchase Details
Closed on
Apr 25, 2005
Sold by
Muns Twyla Lee
Bought by
Union Planters Bank Na
Purchase Details
Closed on
Mar 4, 2003
Bought by
Muns
Purchase Details
Closed on
May 13, 1994
Bought by
Kelley
Purchase Details
Closed on
Jul 5, 1989
Bought by
Kelley
Purchase Details
Closed on
Sep 15, 1983
Bought by
Cox
Create a Home Valuation Report for This Property
The Home Valuation Report is an in-depth analysis detailing your home's value as well as a comparison with similar homes in the area
Home Values in the Area
Average Home Value in this Area
Purchase History
| Date | Buyer | Sale Price | Title Company |
|---|---|---|---|
| Munoz Manuel | $143,000 | Elite Title Company Inc | |
| Fraker Cheryl | $53,666 | None Available | |
| Federal National Mortgage Association | -- | None Available | |
| Union Planters Bank Na | $102,631 | None Available | |
| Muns | $125,000 | -- | |
| Kelley | -- | -- | |
| Kelley | $70,000 | -- | |
| Cox | $69,000 | -- |
Source: Public Records
Mortgage History
| Date | Status | Borrower | Loan Amount |
|---|---|---|---|
| Open | Munoz Manuel | $139,918 |
Source: Public Records
Tax History Compared to Growth
Tax History
| Year | Tax Paid | Tax Assessment Tax Assessment Total Assessment is a certain percentage of the fair market value that is determined by local assessors to be the total taxable value of land and additions on the property. | Land | Improvement |
|---|---|---|---|---|
| 2025 | $1,620 | $47,965 | $8,000 | $39,965 |
| 2024 | $1,459 | $47,965 | $8,000 | $39,965 |
| 2023 | $1,390 | $32,290 | $6,000 | $26,290 |
| 2022 | $1,103 | $32,290 | $6,000 | $26,290 |
| 2021 | $1,035 | $32,290 | $6,000 | $26,290 |
| 2020 | $971 | $25,110 | $4,600 | $20,510 |
| 2019 | $971 | $25,110 | $4,600 | $20,510 |
| 2018 | $996 | $25,110 | $4,600 | $20,510 |
| 2017 | $996 | $25,110 | $4,600 | $20,510 |
| 2016 | $908 | $25,110 | $4,600 | $20,510 |
| 2015 | $1,187 | $24,670 | $4,800 | $19,870 |
| 2014 | $887 | $24,670 | $4,800 | $19,870 |
Source: Public Records
Map
Nearby Homes
- TRACT A 3210 S Blue Hill Rd
- TRACT C 3210 S Blue Hill Rd
- 0 Graham Ln
- 3300 Blue Hill Rd
- 13780 Crazy Horse Dr
- 2002 S M St
- 0 Panorama Rd
- 1221 E New Hope Rd
- 13708 Crazy Horse Dr
- 2711 Aspen Ln
- 908 E New Hope Rd
- 2717 Aspen Ln
- Tract 3 Pinewoods Dr
- 1105 E Linden St
- 1009 E Linden St
- 1006 E Longview Dr
- 0 S Breckenridge St
- 834 Mccann Rd
- 1505 Breckenridge Loop
- 14090 Canal St
- 2612 Graham Dr
- 2300 Sequoyah Dr
- 2355 Sequoyah Dr
- Lot 46 Sequoyah Dr
- 2305 Sequoyah Dr
- Lot 43 Sequoyah Dr
- 2611 E Graham Dr
- 2610 E Graham Dr
- 2609 E Graham Dr
- 2608 E Graham Dr
- 2405 Sequoyah Dr
- 2455 Sequoyah Dr
- 2217 S Blue Hill Rd
- 2607 E Graham Dr
- 2607 Graham Dr
- 2500 Sequoyah Dr
- 2606 E Graham Dr
- 2606 Graham Dr
- 2605 E Graham Dr
- 2505 Sequoyah Dr