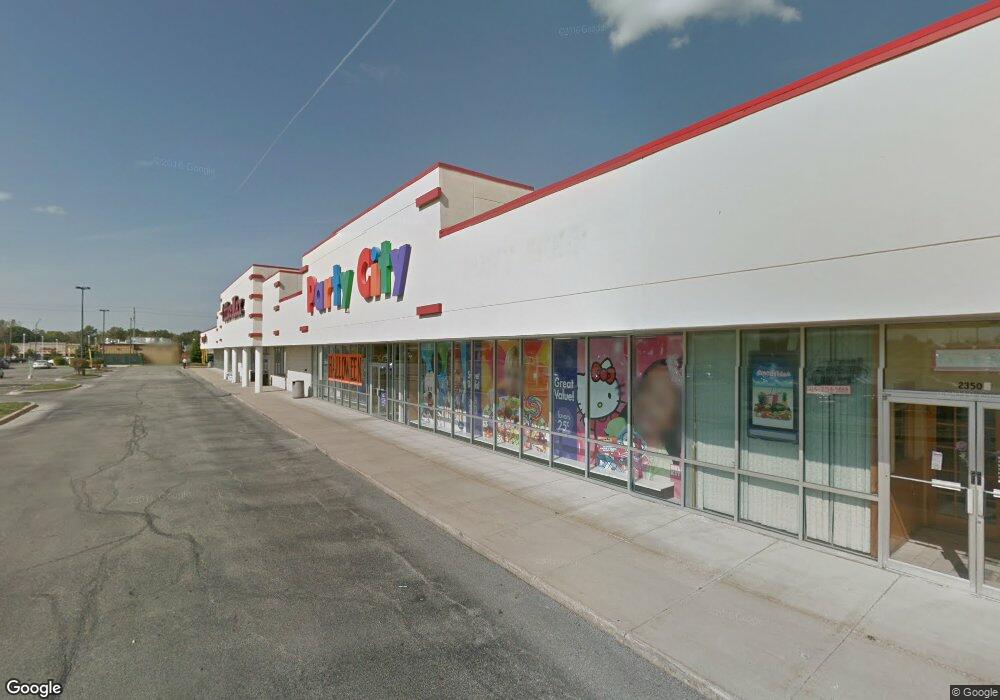
2350 Sycamore Rd Dekalb, IL 60115
--
Bed
--
Bath
58,000
Sq Ft
6.24
Acres
About This Home
This home is located at 2350 Sycamore Rd, Dekalb, IL 60115. 2350 Sycamore Rd is a home located in DeKalb County with nearby schools including Cortland Elementary School, Huntley Middle School, and De Kalb High School.
Ownership History
Date
Name
Owned For
Owner Type
Purchase Details
Closed on
Nov 20, 2024
Sold by
Gw Dekalb Llc and Gw Dekalb Investors Llc
Bought by
Rea9 Asset Llc
Home Financials for this Owner
Home Financials are based on the most recent Mortgage that was taken out on this home.
Original Mortgage
$2,800,000
Outstanding Balance
$2,622,674
Interest Rate
5.71%
Mortgage Type
Credit Line Revolving
Purchase Details
Closed on
May 15, 2023
Sold by
Riversourceki Llc
Bought by
Gw Dekalb Llc and Gw Dekalb Investors Llc
Home Financials for this Owner
Home Financials are based on the most recent Mortgage that was taken out on this home.
Original Mortgage
$3,400,000
Interest Rate
5.76%
Mortgage Type
Credit Line Revolving
Purchase Details
Closed on
Jan 8, 2008
Sold by
Ftv Deklab Llc
Bought by
Dekalb Associates Llc
Home Financials for this Owner
Home Financials are based on the most recent Mortgage that was taken out on this home.
Original Mortgage
$4,865,000
Interest Rate
6.17%
Mortgage Type
Commercial
Create a Home Valuation Report for This Property
The Home Valuation Report is an in-depth analysis detailing your home's value as well as a comparison with similar homes in the area
Home Values in the Area
Average Home Value in this Area
Purchase History
| Date | Buyer | Sale Price | Title Company |
|---|---|---|---|
| Rea9 Asset Llc | $4,050,000 | First American Title | |
| Gw Dekalb Llc | $1,750,000 | Greater Illinois Title | |
| Dekalb Associates Llc | $6,300,000 | -- |
Source: Public Records
Mortgage History
| Date | Status | Borrower | Loan Amount |
|---|---|---|---|
| Open | Rea9 Asset Llc | $2,800,000 | |
| Previous Owner | Gw Dekalb Llc | $3,400,000 | |
| Previous Owner | Dekalb Associates Llc | $4,865,000 |
Source: Public Records
Tax History Compared to Growth
Tax History
| Year | Tax Paid | Tax Assessment Tax Assessment Total Assessment is a certain percentage of the fair market value that is determined by local assessors to be the total taxable value of land and additions on the property. | Land | Improvement |
|---|---|---|---|---|
| 2024 | $72,478 | $973,376 | $678,954 | $294,422 |
| 2023 | $72,478 | $740,312 | $591,991 | $148,321 |
| 2022 | $157,755 | $1,503,810 | $540,483 | $963,327 |
| 2021 | $161,866 | $1,410,439 | $506,925 | $903,514 |
| 2020 | $230,041 | $1,759,572 | $498,844 | $1,260,728 |
| 2019 | $198,367 | $1,690,433 | $479,243 | $1,211,190 |
| 2018 | $193,693 | $1,633,111 | $462,992 | $1,170,119 |
| 2017 | $195,535 | $1,569,846 | $445,056 | $1,124,790 |
| 2016 | $193,372 | $1,530,213 | $433,820 | $1,096,393 |
| 2015 | -- | $1,400,420 | $411,048 | $989,372 |
| 2014 | -- | $1,418,434 | $416,335 | $1,002,099 |
| 2013 | -- | $1,489,952 | $437,327 | $1,052,625 |
Source: Public Records
Map
Nearby Homes
- TBD Greenwood Acres Dr
- 1431 Hulmes Dr
- 1461 Waterside Dr
- 1435 Cambria Dr
- 1537 Hulmes Dr
- 1510 E Dresser Rd
- 338 Greenwood N
- 1514 Oakwood Ave
- 301 River Dr
- 141 Terrace Dr
- 3051 Fairway Oaks Dr
- Lot 7 Aberdeen Ct
- Lot 104 Aberdeen Ct
- 120 Stoney Creek Rd
- 1113 N 13th St
- 113 Andresen Ct
- 2820 N 1st St
- 3229 Meadow Trail E
- 135 Oak Dr
- 928 N 14th St
- 0 Sycamore Rd Unit 7938481
- 1383 Barber Greene Rd
- 2410 Sycamore Rd
- 1488 Barber Greene Rd
- 1472 Barber Greene Rd
- 2215 Sycamore Rd
- 2444 Sycamore Rd
- 2201 Sycamore Rd
- 1586 Barber Greene Rd
- 2239 Sycamore Rd
- 2211 Sycamore Rd
- 2179 Sycamore Rd Unit 203
- 2179 Sycamore Rd Unit 207
- 2179 Sycamore Rd Unit 201
- 2179 Sycamore Rd Unit 104
- 2179 Sycamore Rd Unit 205
- 2179 Sycamore Rd
- 2179 Sycamore Rd Unit 103
- 2561 Sycamore Rd
- 2563 Sycamore Rd