Estimated Value: $576,000 - $934,000
2
Beds
1
Bath
734
Sq Ft
$957/Sq Ft
Est. Value
About This Home
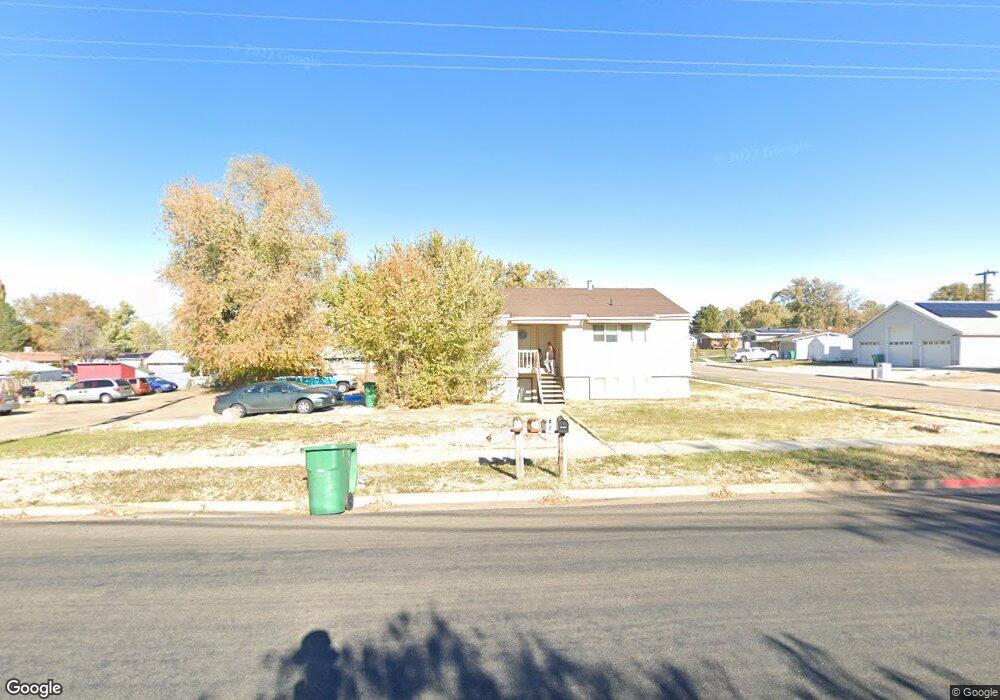
This home is located at 2350 W 6000 S, Roy, UT 84067 and is currently estimated at $702,121, approximately $956 per square foot. 2350 W 6000 S is a home located in Weber County with nearby schools including Municipal School, Roy Junior High School, and Roy High School.
Ownership History
Date
Name
Owned For
Owner Type
Purchase Details
Closed on
Sep 17, 2021
Sold by
Hka Propertries Llc
Bought by
Porter Brad and Porter Sheila
Current Estimated Value
Purchase Details
Closed on
Jun 28, 2018
Sold by
Porter Brad and Porter Sheila
Bought by
Hka Properties Llc
Purchase Details
Closed on
Sep 7, 2016
Sold by
Blair Seth
Bought by
Porter Brad and Porter Sheila
Home Financials for this Owner
Home Financials are based on the most recent Mortgage that was taken out on this home.
Original Mortgage
$261,000
Interest Rate
3.48%
Mortgage Type
New Conventional
Create a Home Valuation Report for This Property
The Home Valuation Report is an in-depth analysis detailing your home's value as well as a comparison with similar homes in the area
Home Values in the Area
Average Home Value in this Area
Purchase History
| Date | Buyer | Sale Price | Title Company |
|---|---|---|---|
| Porter Brad | -- | Vanguard Title Ins Agcy | |
| Hka Properties Llc | -- | Accommodation | |
| Porter Brad | -- | Vanguard Title Ins Agency |
Source: Public Records
Mortgage History
| Date | Status | Borrower | Loan Amount |
|---|---|---|---|
| Previous Owner | Porter Brad | $261,000 |
Source: Public Records
Tax History Compared to Growth
Tax History
| Year | Tax Paid | Tax Assessment Tax Assessment Total Assessment is a certain percentage of the fair market value that is determined by local assessors to be the total taxable value of land and additions on the property. | Land | Improvement |
|---|---|---|---|---|
| 2025 | $3,863 | $349,030 | $110,000 | $239,030 |
| 2024 | $3,771 | $343,200 | $110,000 | $233,200 |
| 2023 | $3,594 | $327,250 | $81,400 | $245,850 |
| 2022 | $3,675 | $343,750 | $55,000 | $288,750 |
| 2021 | $2,820 | $432,000 | $100,000 | $332,000 |
| 2020 | $2,660 | $374,000 | $69,945 | $304,055 |
| 2019 | $2,467 | $325,600 | $40,016 | $285,584 |
| 2018 | $1,975 | $241,204 | $37,998 | $203,206 |
| 2017 | $1,973 | $227,000 | $34,990 | $192,010 |
| 2016 | $1,770 | $108,626 | $16,500 | $92,126 |
| 2015 | $1,573 | $98,221 | $16,500 | $81,721 |
| 2014 | $1,626 | $100,923 | $17,050 | $83,873 |
Source: Public Records
Map
Nearby Homes