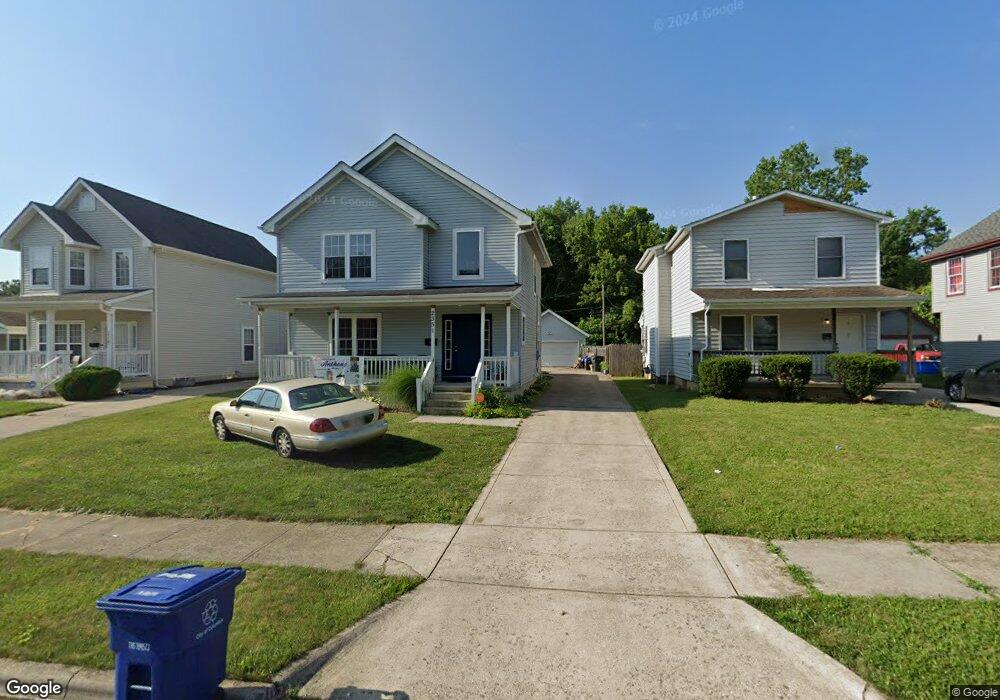
2351 Ehring Rd Columbus, OH 43211
Arlington Park NeighborhoodEstimated Value: $235,239 - $286,000
3
Beds
3
Baths
1,808
Sq Ft
$142/Sq Ft
Est. Value
About This Home
This home is located at 2351 Ehring Rd, Columbus, OH 43211 and is currently estimated at $257,560, approximately $142 per square foot. 2351 Ehring Rd is a home located in Franklin County with nearby schools including East Linden Elementary School, Mifflin Middle School, and Mifflin High School.
Ownership History
Date
Name
Owned For
Owner Type
Purchase Details
Closed on
Dec 10, 2010
Sold by
Bowman Lamont D and Bowman Lamont D
Bought by
Bowman Dawn M
Current Estimated Value
Purchase Details
Closed on
Nov 20, 2003
Sold by
Wake Forest Contractors Inc
Bought by
Bowman Lamont D and Bowman Dawn M
Home Financials for this Owner
Home Financials are based on the most recent Mortgage that was taken out on this home.
Original Mortgage
$126,400
Outstanding Balance
$59,006
Interest Rate
6.1%
Mortgage Type
Purchase Money Mortgage
Estimated Equity
$198,554
Purchase Details
Closed on
May 21, 2003
Sold by
Greater Columbus Habitat For Humanity
Bought by
Wake Forest Constractors Inc
Home Financials for this Owner
Home Financials are based on the most recent Mortgage that was taken out on this home.
Original Mortgage
$127,500
Interest Rate
5.88%
Mortgage Type
Credit Line Revolving
Purchase Details
Closed on
Nov 2, 1993
Create a Home Valuation Report for This Property
The Home Valuation Report is an in-depth analysis detailing your home's value as well as a comparison with similar homes in the area
Home Values in the Area
Average Home Value in this Area
Purchase History
| Date | Buyer | Sale Price | Title Company |
|---|---|---|---|
| Bowman Dawn M | -- | Attorney | |
| Bowman Lamont D | $150,000 | Cardinal Title | |
| Wake Forest Constractors Inc | $5,200 | Warranty Title | |
| -- | -- | -- |
Source: Public Records
Mortgage History
| Date | Status | Borrower | Loan Amount |
|---|---|---|---|
| Open | Bowman Lamont D | $126,400 | |
| Previous Owner | Wake Forest Constractors Inc | $127,500 | |
| Closed | Bowman Lamont D | $12,850 |
Source: Public Records
Tax History Compared to Growth
Tax History
| Year | Tax Paid | Tax Assessment Tax Assessment Total Assessment is a certain percentage of the fair market value that is determined by local assessors to be the total taxable value of land and additions on the property. | Land | Improvement |
|---|---|---|---|---|
| 2024 | $3,173 | $70,700 | $6,160 | $64,540 |
| 2023 | $3,132 | $70,700 | $6,160 | $64,540 |
| 2022 | $1,451 | $27,970 | $1,930 | $26,040 |
| 2021 | $1,453 | $27,970 | $1,930 | $26,040 |
| 2020 | $1,455 | $27,970 | $1,930 | $26,040 |
| 2019 | $1,427 | $23,520 | $1,680 | $21,840 |
| 2018 | $1,917 | $23,520 | $1,680 | $21,840 |
| 2017 | $2,040 | $23,520 | $1,680 | $21,840 |
| 2016 | $2,655 | $40,080 | $2,170 | $37,910 |
| 2015 | $2,410 | $40,080 | $2,170 | $37,910 |
| 2014 | $2,416 | $40,080 | $2,170 | $37,910 |
| 2013 | $1,402 | $47,145 | $2,555 | $44,590 |
Source: Public Records
Map
Nearby Homes
- 2792 Perdue Ave
- 2775 Perdue Ave
- 2810 Baughman Ave
- 2559 Milford Ave
- 2585 Perdue Ave
- 2828 Linview Ave
- 2683 Club House Dr
- 0 Club House Dr
- 2076 Agler Rd
- 2100 Aberdeen Ave
- 3781 Aberdeen Ave
- 3775 Aberdeen Ave
- 2096 Minnesota Ave
- 1967 Denune Ave
- 2386 Century Dr
- 2765 Joyce Ave
- 3137 Westerville Rd Unit 91
- 3137 Westerville Rd Unit 44
- 1961 Aberdeen Ave
- 1995 Minnesota Ave
- 2345 Ehring Rd
- 2357 Ehring Rd
- 2339 Ehring Rd
- 2363 Ehring Rd
- 2774 Woodland Ave
- 2780 Woodland Ave
- 2350 Ehring Rd
- 2346 Ehring Rd
- 2770 Woodland Ave
- 2340 Ehring Rd
- 2358 Ehring Rd
- 2764 Woodland Ave
- 2796 Woodland Ave
- 2760 Woodland Ave
- 2802 Woodland Ave
- 2754 Woodland Ave
- 2810 Woodland Ave
- 0 Agler Rd
- 2787 Woodland Ave
- 2355 Milford Ave