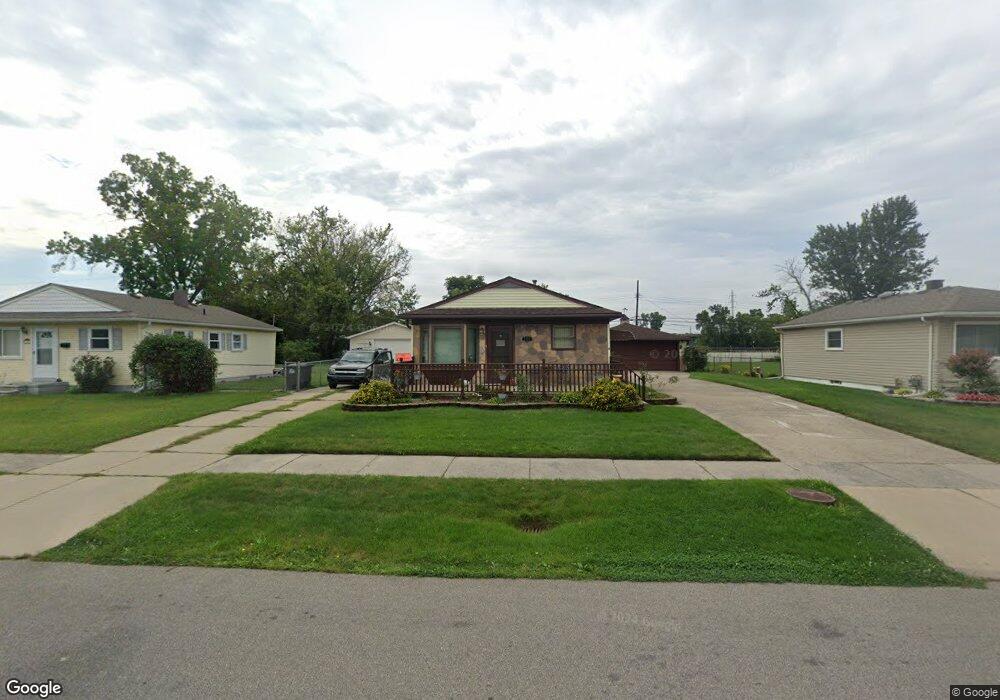
23515 Newcastle St Taylor, MI 48180
Estimated Value: $155,000 - $173,000
--
Bed
--
Bath
852
Sq Ft
$195/Sq Ft
Est. Value
About This Home
This home is located at 23515 Newcastle St, Taylor, MI 48180 and is currently estimated at $166,513, approximately $195 per square foot. 23515 Newcastle St is a home located in Wayne County with nearby schools including Clarence Randall Elementary School, Hoover Middle School, and Quest Charter Academy.
Ownership History
Date
Name
Owned For
Owner Type
Purchase Details
Closed on
Jun 30, 2023
Sold by
Barbara J Belcher Revocable Living Trust
Bought by
Polito Anthony Rocco
Current Estimated Value
Home Financials for this Owner
Home Financials are based on the most recent Mortgage that was taken out on this home.
Original Mortgage
$10,000
Outstanding Balance
$9,752
Interest Rate
6.57%
Estimated Equity
$156,761
Purchase Details
Closed on
Jun 28, 2021
Sold by
Belcher Barbara J
Bought by
Belcher Barbara J and Barbara J Belcher Revocable Li
Purchase Details
Closed on
Nov 8, 2018
Sold by
Belcher Barbara J
Bought by
Belcher Barbara J
Home Financials for this Owner
Home Financials are based on the most recent Mortgage that was taken out on this home.
Original Mortgage
$34,325
Interest Rate
4.7%
Mortgage Type
FHA
Create a Home Valuation Report for This Property
The Home Valuation Report is an in-depth analysis detailing your home's value as well as a comparison with similar homes in the area
Home Values in the Area
Average Home Value in this Area
Purchase History
| Date | Buyer | Sale Price | Title Company |
|---|---|---|---|
| Polito Anthony Rocco | $155,000 | Minnesota Title | |
| Polito Anthony Rocco | $155,000 | Minnesota Title | |
| Belcher Barbara J | -- | None Available | |
| Belcher Barbara J | -- | Timios Inc |
Source: Public Records
Mortgage History
| Date | Status | Borrower | Loan Amount |
|---|---|---|---|
| Open | Polito Anthony Rocco | $10,000 | |
| Closed | Polito Anthony Rocco | $10,000 | |
| Open | Polito Anthony Rocco | $150,350 | |
| Closed | Polito Anthony Rocco | $150,350 | |
| Previous Owner | Belcher Barbara J | $34,325 |
Source: Public Records
Tax History Compared to Growth
Tax History
| Year | Tax Paid | Tax Assessment Tax Assessment Total Assessment is a certain percentage of the fair market value that is determined by local assessors to be the total taxable value of land and additions on the property. | Land | Improvement |
|---|---|---|---|---|
| 2025 | $3,106 | $81,300 | $0 | $0 |
| 2024 | $3,106 | $71,600 | $0 | $0 |
| 2023 | $2,010 | $63,500 | $0 | $0 |
| 2022 | $1,598 | $56,900 | $0 | $0 |
| 2021 | $1,767 | $51,600 | $0 | $0 |
| 2020 | $1,749 | $46,700 | $0 | $0 |
| 2019 | $234,839 | $38,100 | $0 | $0 |
| 2018 | $1,372 | $32,500 | $0 | $0 |
| 2017 | $764 | $33,100 | $0 | $0 |
| 2016 | $1,708 | $32,200 | $0 | $0 |
| 2015 | $3,100 | $31,000 | $0 | $0 |
| 2013 | $3,150 | $32,600 | $0 | $0 |
| 2012 | $1,381 | $31,800 | $11,100 | $20,700 |
Source: Public Records
Map
Nearby Homes
- 23527 Newcastle St
- 23503 Newcastle St
- 23539 Newcastle St
- 23471 Newcastle St
- 6767 Pine St
- 23551 Newcastle St
- 23457 Newcastle St
- 6768 Oak St
- 6752 Oak St
- 6753 Pine St
- 23563 Newcastle St
- 23443 Newcastle St
- 6744 Oak St
- 6745 Pine St
- 23575 Newcastle St
- 23429 Newcastle St
- 6736 Oak St
- 6768 Pine St
- 6737 Pine St
- 6752 Pine St