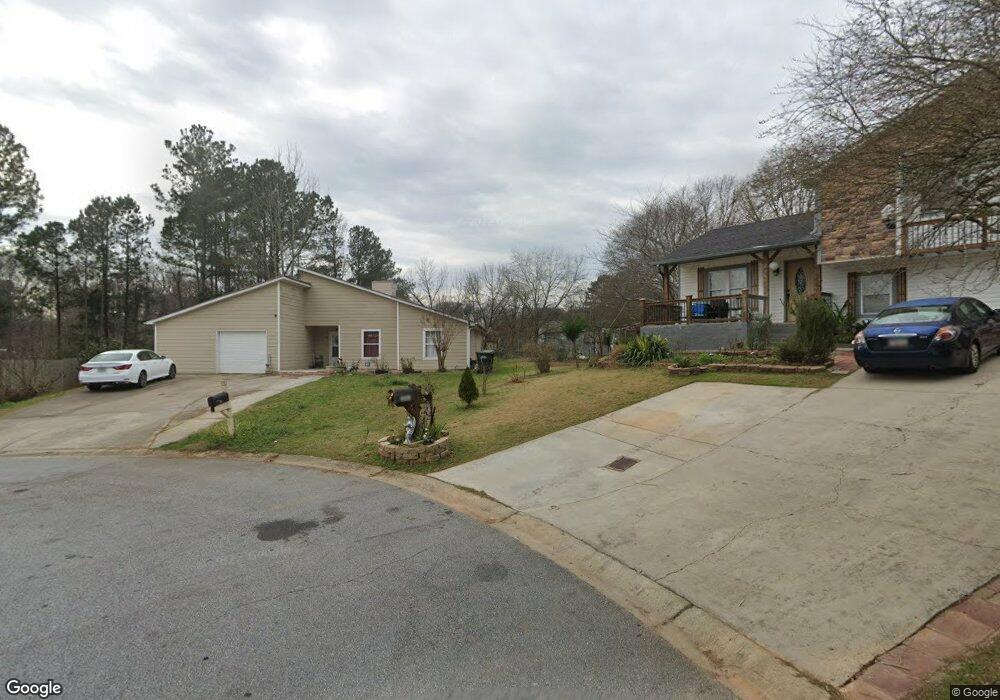
2352 Marshes Glenn Ct Norcross, GA 30071
Estimated Value: $313,000 - $352,000
3
Beds
2
Baths
1,344
Sq Ft
$252/Sq Ft
Est. Value
About This Home
This home is located at 2352 Marshes Glenn Ct, Norcross, GA 30071 and is currently estimated at $338,193, approximately $251 per square foot. 2352 Marshes Glenn Ct is a home located in Gwinnett County with nearby schools including Baldwin Elementary, Summerour Middle School, and Paul Duke STEM High School.
Ownership History
Date
Name
Owned For
Owner Type
Purchase Details
Closed on
Nov 10, 2011
Sold by
Secretary Of Housing And U
Bought by
Thavisack Christina M and Thavisack Laty
Current Estimated Value
Purchase Details
Closed on
Aug 2, 2011
Sold by
Midfirst Bank
Bought by
Secretary Of Housing & Urban D
Purchase Details
Closed on
Feb 23, 2001
Sold by
Duarte Sebastian
Bought by
Duarte Sebastian and Duarte Dora
Home Financials for this Owner
Home Financials are based on the most recent Mortgage that was taken out on this home.
Original Mortgage
$109,066
Interest Rate
7.12%
Mortgage Type
New Conventional
Purchase Details
Closed on
May 24, 2000
Sold by
Duarte Sebastian
Bought by
Duarte Sebastian and Duarte Dora
Home Financials for this Owner
Home Financials are based on the most recent Mortgage that was taken out on this home.
Original Mortgage
$109,800
Interest Rate
8.11%
Mortgage Type
FHA
Purchase Details
Closed on
Nov 6, 1996
Sold by
Sun Chien Kang Chi Hua
Bought by
Alvarez Ramiro and Afaro Glenda
Create a Home Valuation Report for This Property
The Home Valuation Report is an in-depth analysis detailing your home's value as well as a comparison with similar homes in the area
Home Values in the Area
Average Home Value in this Area
Purchase History
| Date | Buyer | Sale Price | Title Company |
|---|---|---|---|
| Thavisack Christina M | $45,900 | -- | |
| Secretary Of Housing & Urban D | $109,108 | -- | |
| Midfirst Bank | $109,108 | -- | |
| Duarte Sebastian | -- | -- | |
| Duarte Sebastian | -- | -- | |
| Duarte Sebastian | $109,900 | -- | |
| Alvarez Ramiro | $85,500 | -- |
Source: Public Records
Mortgage History
| Date | Status | Borrower | Loan Amount |
|---|---|---|---|
| Previous Owner | Duarte Sebastian | $109,066 | |
| Previous Owner | Duarte Sebastian | $109,800 | |
| Closed | Alvarez Ramiro | $0 |
Source: Public Records
Tax History Compared to Growth
Tax History
| Year | Tax Paid | Tax Assessment Tax Assessment Total Assessment is a certain percentage of the fair market value that is determined by local assessors to be the total taxable value of land and additions on the property. | Land | Improvement |
|---|---|---|---|---|
| 2025 | $2,527 | $122,880 | $25,840 | $97,040 |
| 2024 | $1,458 | $100,360 | $20,400 | $79,960 |
| 2023 | $1,458 | $100,360 | $20,400 | $79,960 |
| 2022 | $1,464 | $100,360 | $20,400 | $79,960 |
| 2021 | $928 | $61,160 | $14,120 | $47,040 |
| 2020 | $1,443 | $61,160 | $14,120 | $47,040 |
| 2019 | $1,350 | $54,440 | $12,800 | $41,640 |
| 2018 | $1,166 | $48,080 | $10,000 | $38,080 |
| 2016 | $1,170 | $48,080 | $10,000 | $38,080 |
| 2015 | $827 | $21,720 | $4,400 | $17,320 |
| 2014 | -- | $21,720 | $4,400 | $17,320 |
Source: Public Records
Map
Nearby Homes
- 724 Camelot Way
- 2848 Wild Laurel Ct
- 5645 Hammond Dr
- 2199 Summertown Dr
- 5766 Buford Hwy
- 5457 Rails Way
- 5479 Windy Creek Ln
- 5639 Chatham Cir
- 5596 Buford Hwy
- 392 Price Place NW
- 2375 Beaver Falls Dr
- 5364 Hickory Knoll
- 5358 Beaver Branch
- 5381 Station Cir Unit 3
- 5357 Beaver Branch
- 5670 Hollow Ridge Ln
- 622 Summer Place
- 5341 Goodwick Way
- 2009 Hoot Owl Trail
- 90 W Peachtree St
- 2341 Marshes Glenn Ct
- 2342 Marshes Glenn Ct
- 2144 Marshes Glenn Dr
- 2150 Marshes Glenn Dr
- 2138 Marshes Glenn Dr
- 2156 Marshes Glenn Dr Unit 3
- 2168 Marshes Glenn Dr
- 5783 Glenn Hollow Ln
- 2331 Marshes Glenn Ct
- 2332 Marshes Glenn Ct Unit 3
- 5777 Glenn Hollow Ln
- 5789 Glenn Hollow Ln
- 2180 Marshes Glenn Dr Unit 3
- 2180 Marshes Glen
- 5771 Glenn Hollow Ln
- 5795 Glenn Hollow Ln
- 2186 Marshes Glenn Dr Unit 3
- 2321 Marshes Glenn Ct
- 2322 Marshes Glenn Ct
- 2192 Marshes Glenn Dr Unit 3