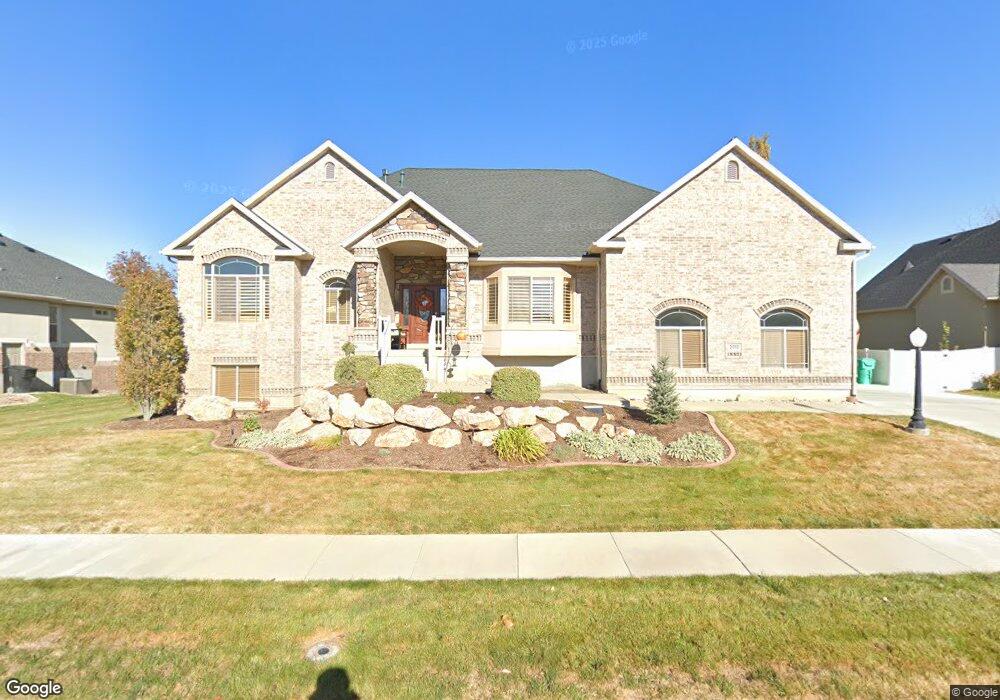
2352 W 1125 S Syracuse, UT 84075
Estimated Value: $786,000 - $820,778
5
Beds
4
Baths
4,486
Sq Ft
$179/Sq Ft
Est. Value
About This Home
This home is located at 2352 W 1125 S, Syracuse, UT 84075 and is currently estimated at $804,945, approximately $179 per square foot. 2352 W 1125 S is a home located in Davis County with nearby schools including Syracuse Elementary School, Syracuse Junior High School, and Syracuse High School.
Ownership History
Date
Name
Owned For
Owner Type
Purchase Details
Closed on
Dec 1, 2020
Sold by
Jackson Jeff T and Jackson Tammara M
Bought by
Marrufo Steven R and Marrufo Thida
Current Estimated Value
Home Financials for this Owner
Home Financials are based on the most recent Mortgage that was taken out on this home.
Original Mortgage
$600,000
Outstanding Balance
$533,915
Interest Rate
2.8%
Mortgage Type
VA
Estimated Equity
$271,030
Purchase Details
Closed on
Jul 7, 2006
Sold by
Carlton Place Llc
Bought by
Jackson Jeff T and Jackson Tammara M
Home Financials for this Owner
Home Financials are based on the most recent Mortgage that was taken out on this home.
Original Mortgage
$87,380
Interest Rate
6.17%
Mortgage Type
Unknown
Create a Home Valuation Report for This Property
The Home Valuation Report is an in-depth analysis detailing your home's value as well as a comparison with similar homes in the area
Home Values in the Area
Average Home Value in this Area
Purchase History
| Date | Buyer | Sale Price | Title Company |
|---|---|---|---|
| Marrufo Steven R | -- | Advantage Tit | |
| Jackson Jeff T | -- | Founders Title Co | |
| Carlton Place Llc | -- | Founders Title Co |
Source: Public Records
Mortgage History
| Date | Status | Borrower | Loan Amount |
|---|---|---|---|
| Open | Marrufo Steven R | $600,000 | |
| Previous Owner | Jackson Jeff T | $87,380 | |
| Previous Owner | Jackson Jeff T | $349,520 |
Source: Public Records
Tax History Compared to Growth
Tax History
| Year | Tax Paid | Tax Assessment Tax Assessment Total Assessment is a certain percentage of the fair market value that is determined by local assessors to be the total taxable value of land and additions on the property. | Land | Improvement |
|---|---|---|---|---|
| 2025 | $1,100 | $419,100 | $133,538 | $285,562 |
| 2024 | $994 | $399,850 | $119,198 | $280,652 |
| 2023 | $1,062 | $711,000 | $165,569 | $545,431 |
| 2022 | $2,439 | $407,000 | $94,071 | $312,929 |
| 2021 | $1,753 | $564,000 | $140,037 | $423,963 |
| 2020 | $3,246 | $472,000 | $117,546 | $354,454 |
| 2019 | $3,176 | $456,000 | $120,351 | $335,649 |
| 2018 | $2,983 | $425,000 | $113,272 | $311,728 |
| 2016 | $2,742 | $204,930 | $43,277 | $161,653 |
| 2015 | $2,791 | $198,605 | $43,277 | $155,328 |
| 2014 | $2,745 | $199,104 | $43,277 | $155,827 |
| 2013 | -- | $175,447 | $37,278 | $138,169 |
Source: Public Records
Map
Nearby Homes
- 2655 S 2430 W Unit 120
- 2665 S 2430 W Unit 118
- 2655 S 2430 W Unit 116
- 2633 S 2430 W Unit 113
- 2614 S 2430 W Unit 106
- 2663 S 2430 W
- 2050 Craftsman Plan at Legacy Park - Collection
- 2200 Garden Plan at Legacy Park - Collection
- Lincoln Farmhouse Plan at Legacy Park - Estates
- Hamilton Traditional Plan at Legacy Park - Estates
- Tivoli Traditional Plan at Legacy Park - Estates
- Torino Farmhouse Plan at Legacy Park - Estates
- 2400 Farmhouse Plan at Legacy Park - Collection
- 2117 W 1275 S
- 1641 S 2350 W Unit B
- 2840 W 1200 S
- 916 S 1760 W
- 922 S 1760 W
- 2679 W Antelope Dr
- 1251 S 1650 W