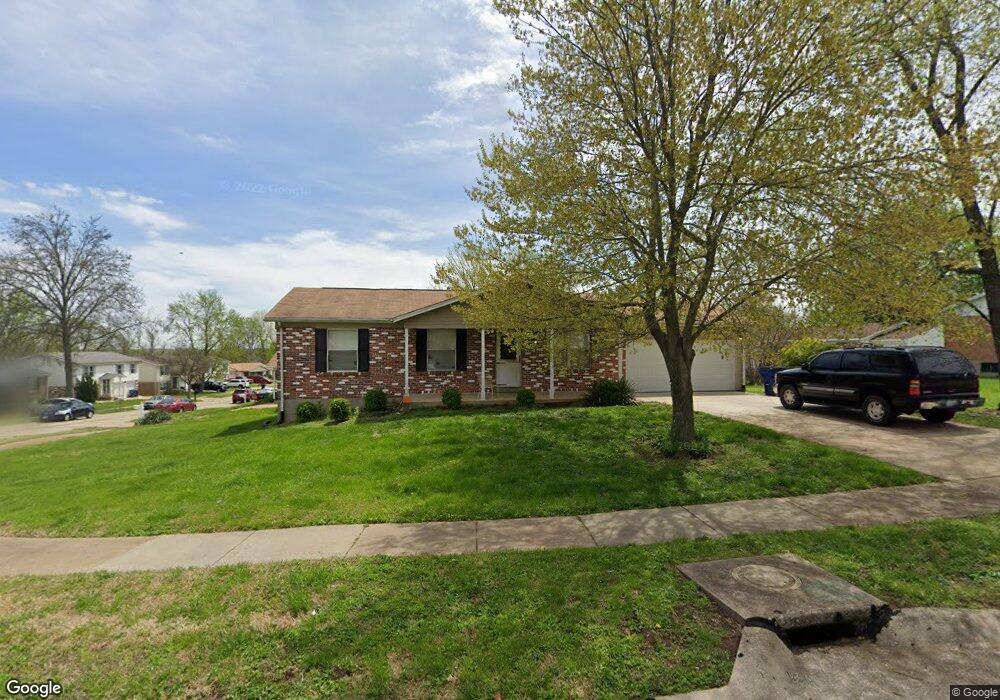
2353 Bensonhurst Dr Florissant, MO 63031
Estimated Value: $191,000 - $214,000
3
Beds
2
Baths
1,189
Sq Ft
$167/Sq Ft
Est. Value
About This Home
This home is located at 2353 Bensonhurst Dr, Florissant, MO 63031 and is currently estimated at $198,884, approximately $167 per square foot. 2353 Bensonhurst Dr is a home located in St. Louis County with nearby schools including Walker Elementary School, Northwest Middle School, and Hazelwood West High School.
Ownership History
Date
Name
Owned For
Owner Type
Purchase Details
Closed on
Aug 27, 2015
Sold by
Pleasant Hollow Ltd
Bought by
Ovation Property Holdings 2015-B Llc
Current Estimated Value
Home Financials for this Owner
Home Financials are based on the most recent Mortgage that was taken out on this home.
Original Mortgage
$3,410,500
Outstanding Balance
$2,682,340
Interest Rate
4.03%
Mortgage Type
Commercial
Estimated Equity
-$2,483,456
Create a Home Valuation Report for This Property
The Home Valuation Report is an in-depth analysis detailing your home's value as well as a comparison with similar homes in the area
Home Values in the Area
Average Home Value in this Area
Purchase History
| Date | Buyer | Sale Price | Title Company |
|---|---|---|---|
| Ovation Property Holdings 2015-B Llc | $2,177,500 | Servicelink |
Source: Public Records
Mortgage History
| Date | Status | Borrower | Loan Amount |
|---|---|---|---|
| Open | Ovation Property Holdings 2015-B Llc | $3,410,500 |
Source: Public Records
Tax History Compared to Growth
Tax History
| Year | Tax Paid | Tax Assessment Tax Assessment Total Assessment is a certain percentage of the fair market value that is determined by local assessors to be the total taxable value of land and additions on the property. | Land | Improvement |
|---|---|---|---|---|
| 2025 | $2,648 | $34,070 | $5,930 | $28,140 |
| 2024 | $2,648 | $30,300 | $3,400 | $26,900 |
| 2023 | $2,645 | $30,300 | $3,400 | $26,900 |
| 2022 | $2,214 | $22,560 | $3,900 | $18,660 |
| 2021 | $2,182 | $22,560 | $3,900 | $18,660 |
| 2020 | $2,069 | $19,900 | $3,900 | $16,000 |
| 2019 | $2,037 | $19,900 | $3,900 | $16,000 |
| 2018 | $1,571 | $14,060 | $2,530 | $11,530 |
| 2017 | $1,570 | $14,060 | $2,530 | $11,530 |
| 2016 | $1,591 | $14,060 | $2,910 | $11,150 |
| 2015 | $1,557 | $14,060 | $2,910 | $11,150 |
| 2014 | $1,431 | $13,300 | $3,880 | $9,420 |
Source: Public Records
Map
Nearby Homes
- 2235 Central Parkway Dr
- 2618 Freemantle Dr
- 2437 Periwinkle Ct
- 2347 Farflung Dr
- 2106 Kingsford Dr
- 2042 Farflung Dr
- 2314 Stoney End Ct
- 1834 Night Dr
- 2112 Millvalley Dr
- 2216 Foggy Bottom Dr
- 1885 High Sun Dr
- 1907 High Sun Dr
- 1920 High Sun Dr
- 1863 High Sun Dr Unit 51863
- 2916 Corn Silk Ct
- 2112 New Sun Dr
- 1831 New Sun Ct Unit 5
- 1830 New Sun Ct
- 1920 Shackelford Rd
- 3035 Matlock Dr
- 2244 Larbrook Dr
- 2345 Bensonhurst Dr
- 2240 Larbrook Dr
- 2267 Central Pkwy
- 2356 Bensonhurst Dr
- 2352 Bensonhurst Dr
- 2253 Larbrook Dr
- 2249 Larbrook Dr
- 2348 Bensonhurst Dr
- 2245 Larbrook Dr
- 2263 Central Parkway Dr
- 2236 Larbrook Dr
- 2241 Larbrook Dr
- 2279 Central Parkway Dr
- 2259 Central Parkway Dr
- 2237 Larbrook Dr
- 2232 Larbrook Dr
- 2270 Central Parkway Dr
- 2233 Larbrook Dr