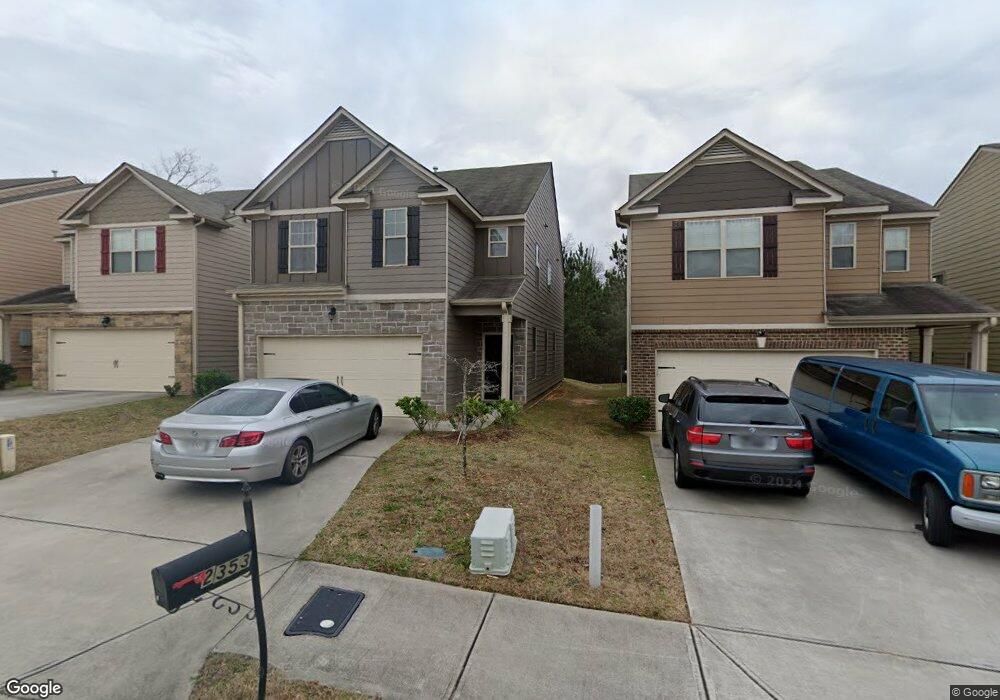
2353 Capella Cir SW Unit 51 Atlanta, GA 30331
Estimated Value: $305,000 - $336,000
3
Beds
3
Baths
1,950
Sq Ft
$161/Sq Ft
Est. Value
About This Home
This home is located at 2353 Capella Cir SW Unit 51, Atlanta, GA 30331 and is currently estimated at $314,076, approximately $161 per square foot. 2353 Capella Cir SW Unit 51 is a home located in Fulton County with nearby schools including Cliftondale Elementary School, Sandtown Middle School, and Westlake High School.
Ownership History
Date
Name
Owned For
Owner Type
Purchase Details
Closed on
Dec 15, 2022
Sold by
Arrived Ga Chattahoochee Llc
Bought by
Leggett Kyree K
Current Estimated Value
Home Financials for this Owner
Home Financials are based on the most recent Mortgage that was taken out on this home.
Original Mortgage
$317,130
Outstanding Balance
$307,005
Interest Rate
6.61%
Mortgage Type
VA
Estimated Equity
$7,071
Purchase Details
Closed on
Jun 21, 2022
Sold by
Opendoor Property Trust I
Bought by
Arrived Ga Chattahoochee Llc
Purchase Details
Closed on
May 13, 2022
Sold by
Johnson Tyson L
Bought by
Opendoor Property Trust I
Purchase Details
Closed on
Mar 9, 2015
Sold by
Wilson Parker Homes Of Anatole
Bought by
Johnson Tyson L
Home Financials for this Owner
Home Financials are based on the most recent Mortgage that was taken out on this home.
Original Mortgage
$157,022
Interest Rate
4.25%
Mortgage Type
FHA
Purchase Details
Closed on
Jun 4, 2013
Sold by
The Knight Grp Inc
Bought by
Redus One Llc
Create a Home Valuation Report for This Property
The Home Valuation Report is an in-depth analysis detailing your home's value as well as a comparison with similar homes in the area
Home Values in the Area
Average Home Value in this Area
Purchase History
| Date | Buyer | Sale Price | Title Company |
|---|---|---|---|
| Leggett Kyree K | $310,000 | -- | |
| Arrived Ga Chattahoochee Llc | $335,000 | -- | |
| Opendoor Property Trust I | $315,300 | -- | |
| Johnson Tyson L | $160,000 | -- | |
| Redus One Llc | $374,000 | -- |
Source: Public Records
Mortgage History
| Date | Status | Borrower | Loan Amount |
|---|---|---|---|
| Open | Leggett Kyree K | $317,130 | |
| Previous Owner | Johnson Tyson L | $157,022 |
Source: Public Records
Tax History Compared to Growth
Tax History
| Year | Tax Paid | Tax Assessment Tax Assessment Total Assessment is a certain percentage of the fair market value that is determined by local assessors to be the total taxable value of land and additions on the property. | Land | Improvement |
|---|---|---|---|---|
| 2025 | $4,692 | $110,200 | $23,760 | $86,440 |
| 2023 | $3,438 | $121,800 | $23,040 | $98,760 |
| 2022 | $3,218 | $82,080 | $25,600 | $56,480 |
| 2021 | $2,932 | $73,240 | $14,480 | $58,760 |
| 2020 | $2,817 | $69,240 | $13,040 | $56,200 |
| 2019 | $2,512 | $63,600 | $8,360 | $55,240 |
| 2018 | $2,313 | $58,120 | $9,120 | $49,000 |
| 2017 | $2,277 | $55,880 | $8,760 | $47,120 |
| 2016 | $2,609 | $64,000 | $10,000 | $54,000 |
| 2015 | $164 | $4,000 | $4,000 | $0 |
| 2014 | $172 | $4,000 | $4,000 | $0 |
Source: Public Records
Map
Nearby Homes
- 6996 Zaniah Rd SW
- 7122 Chara Ln SW
- 7167 Rigel Bend SW
- 2320 Polaris Way SW
- 2162 Capella Cir SW
- 7190 Cavender Dr SW
- 221 Cutbank Ct SW
- 0 Cascade Palmetto Hwy Unit PARCEL 1 10264250
- 6974 Chilkat Ct SW
- 6790 Springfield Way
- 2765 Elkmont Ridge SW
- 6753 Chilkat Ct SW
- 2527 Dayview Ln
- 2718 Serena Way
- 2536 Dayview Ln
- 2725 Piper Dr
- 3030 Parkland View
- 3058 Parkland View
- 6446 Rosetta Dr Unit 63
- 2353 Capella Cir SW
- 2357 Capella Cir SW Unit 50
- 2357 Capella Cir SW
- 2349 Capella Cir SW Unit 52
- 2349 Capella Cir SW
- 2361 Capella Cir SW Unit 49
- 2361 Capella Cir SW
- 2345 Capella Cir SW Unit 53
- 2345 Capella Cir SW
- 2365 Capella Cir SW Unit 48
- 2365 Capella Cir SW
- 2341 Capella Cir SW Unit 54
- 2341 Capella Cir SW
- 2337 Capella Cir SW Unit 55
- 2337 Capella Cir SW
- 2369 Capella Cir SW Unit 47
- 2369 Capella Cir SW
- 2358 Capella Cir SW Unit 3007
- 2358 Capella Cir SW
- 2354 Capella Cir SW Unit 3006