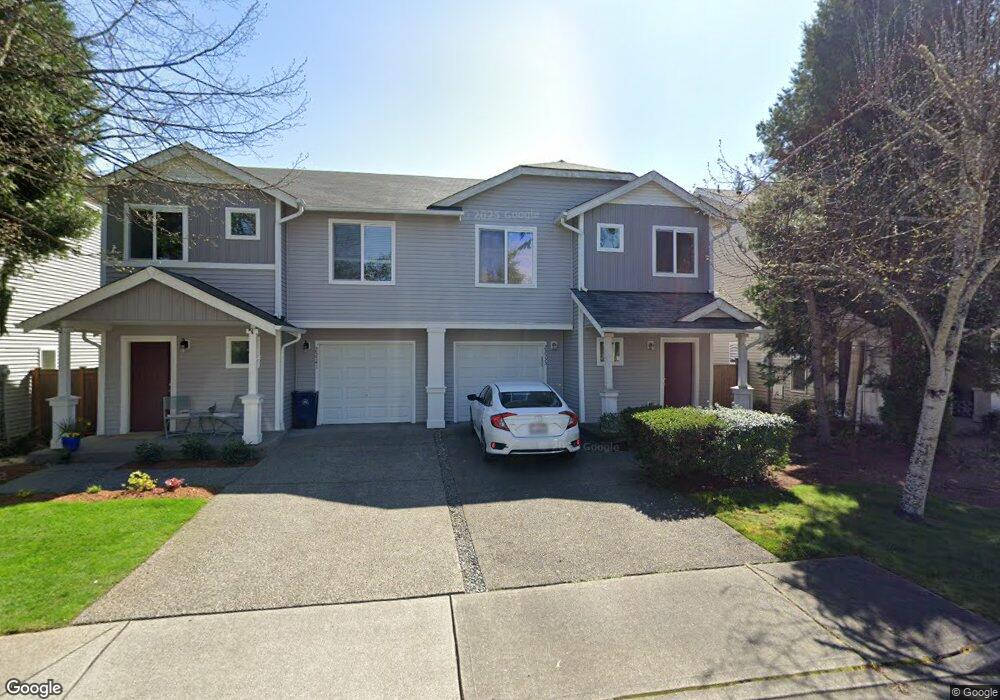
23533 NE 111th St Redmond, WA 98053
Union Hill-Novelty Hill NeighborhoodEstimated Value: $513,000 - $662,000
2
Beds
1
Bath
1,290
Sq Ft
$453/Sq Ft
Est. Value
About This Home
This home is located at 23533 NE 111th St, Redmond, WA 98053 and is currently estimated at $583,778, approximately $452 per square foot. 23533 NE 111th St is a home located in King County with nearby schools including Ella Baker Elementary School, Timberline Middle School, and Redmond High School.
Ownership History
Date
Name
Owned For
Owner Type
Purchase Details
Closed on
Nov 13, 2021
Sold by
Nguyen Tramanh T and Nguyen Van Tran
Bought by
Nguyen Tramanh T and Nguyen Van Tran
Current Estimated Value
Home Financials for this Owner
Home Financials are based on the most recent Mortgage that was taken out on this home.
Original Mortgage
$350,000
Outstanding Balance
$321,378
Interest Rate
3.14%
Mortgage Type
New Conventional
Estimated Equity
$262,400
Purchase Details
Closed on
Dec 3, 2008
Sold by
The Quadrant Corporation
Bought by
Nguyen Tramanh T
Home Financials for this Owner
Home Financials are based on the most recent Mortgage that was taken out on this home.
Original Mortgage
$189,400
Interest Rate
6.47%
Purchase Details
Closed on
Jul 1, 2008
Sold by
Redmond Ridge East Llc
Bought by
The Quadrant Corp
Create a Home Valuation Report for This Property
The Home Valuation Report is an in-depth analysis detailing your home's value as well as a comparison with similar homes in the area
Home Values in the Area
Average Home Value in this Area
Purchase History
| Date | Buyer | Sale Price | Title Company |
|---|---|---|---|
| Nguyen Tramanh T | -- | Accommodation | |
| Nguyen Tramanh T | $236,846 | First American | |
| The Quadrant Corp | $3,175,000 | First American |
Source: Public Records
Mortgage History
| Date | Status | Borrower | Loan Amount |
|---|---|---|---|
| Open | Nguyen Tramanh T | $350,000 | |
| Closed | Nguyen Tramanh T | $189,400 |
Source: Public Records
Tax History Compared to Growth
Tax History
| Year | Tax Paid | Tax Assessment Tax Assessment Total Assessment is a certain percentage of the fair market value that is determined by local assessors to be the total taxable value of land and additions on the property. | Land | Improvement |
|---|---|---|---|---|
| 2024 | $4,522 | $458,268 | $434,000 | $24,268 |
| 2023 | $4,006 | $433,338 | $261,000 | $172,338 |
| 2022 | $4,466 | $433,338 | $261,000 | $172,338 |
| 2021 | $4,622 | $419,036 | $261,000 | $158,036 |
| 2020 | $4,205 | $396,240 | $261,000 | $135,240 |
| 2018 | $4,215 | $362,318 | $261,000 | $101,318 |
| 2017 | $3,975 | $338,797 | $237,000 | $101,797 |
| 2016 | $3,895 | $327,615 | $217,000 | $110,615 |
| 2015 | $3,748 | $316,802 | $191,000 | $125,802 |
| 2014 | -- | $296,235 | $184,000 | $112,235 |
| 2013 | -- | $283,271 | $161,000 | $122,271 |
Source: Public Records
Map
Nearby Homes
- 11037 236th Place NE
- 23905 NE 113th Ln Unit 4
- 23916 NE 115th Ln Unit 204
- 24129 NE 112th Ln Unit 151
- 11008 243rd Ave NE
- 10909 243rd Ave NE
- 22824 NE 100th Place
- 109 XX 248th Ave NE
- 10790 221st Ln NE Unit 28
- 24036 NE Adair Rd
- 10427 248th Ave NE
- 10769 221st Ln NE Unit 18
- 10630 221st Ln NE Unit 204
- 12115 Big Leaf Way NE
- 12415 235th Place NE
- 10129 224th Ave NE
- 10500 221st Ln NE Unit 202
- 12427 243rd Terrace NE
- 12429 243rd Place NE
- 23806 NE 126th Place
- 23541 NE 111th St
- 23525 NE 111th St
- 23549 NE 111th St
- 23517 NE 111th St
- 11070 Elliston Way NE
- 23553 NE 111th St
- 23561 NE 111th St
- 11062 Elliston Way NE
- 11077 236th Place NE
- 23534 NE 111th St
- 23526 NE 111th St
- 23542 NE 111th St
- 23550 NE 111th St
- 23569 NE 111th St
- 11069 236th Place NE
- 11054 Elliston Way NE
- 23558 NE 111th St
- 23510 NE 111th St
- 23502 NE 111th St
- 23566 NE 111th St