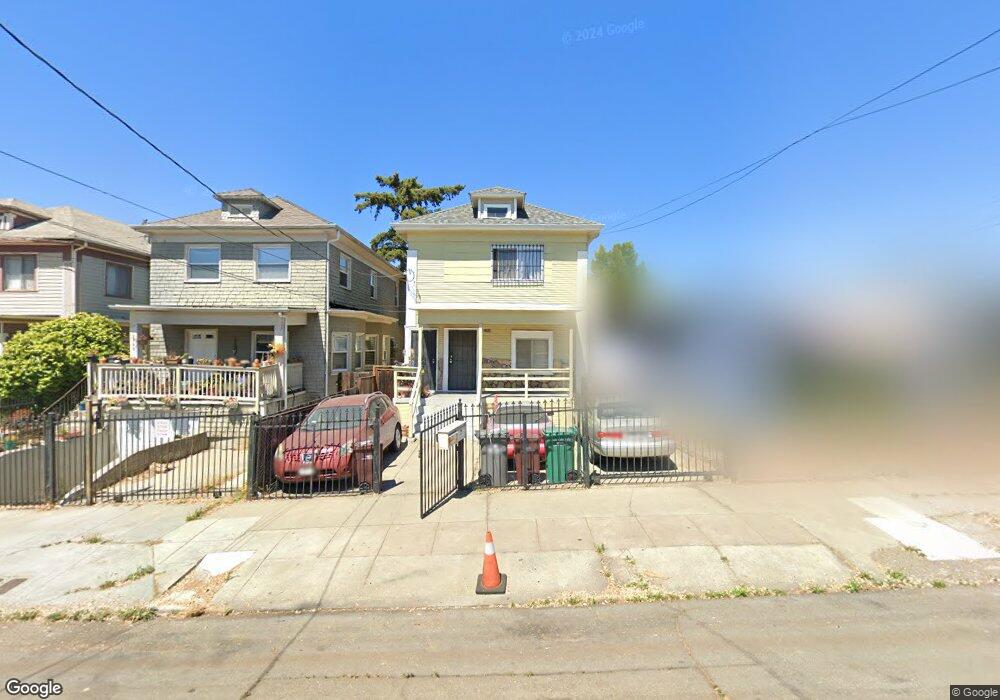
2354 E 20th St Oakland, CA 94601
Meadow Brook NeighborhoodEstimated Value: $508,000 - $716,000
Studio
3
Baths
2,344
Sq Ft
$255/Sq Ft
Est. Value
About This Home
This home is located at 2354 E 20th St, Oakland, CA 94601 and is currently estimated at $597,887, approximately $255 per square foot. 2354 E 20th St is a home located in Alameda County with nearby schools including Garfield Elementary School, Roosevelt Middle School, and Fremont High School.
Ownership History
Date
Name
Owned For
Owner Type
Purchase Details
Closed on
Nov 3, 2012
Sold by
Yeung Gody Wai Ming
Bought by
Yeung Gody Wai Ming and Shou Eric
Current Estimated Value
Home Financials for this Owner
Home Financials are based on the most recent Mortgage that was taken out on this home.
Original Mortgage
$150,000
Outstanding Balance
$25,848
Interest Rate
3.52%
Mortgage Type
New Conventional
Estimated Equity
$572,039
Purchase Details
Closed on
Oct 10, 2012
Sold by
Shou Lauren Sut
Bought by
Yeung Gody Wai Ming
Home Financials for this Owner
Home Financials are based on the most recent Mortgage that was taken out on this home.
Original Mortgage
$150,000
Outstanding Balance
$25,848
Interest Rate
3.52%
Mortgage Type
New Conventional
Estimated Equity
$572,039
Purchase Details
Closed on
Feb 6, 2009
Sold by
Shou Lauren Sut
Bought by
Shou Lauren Sut and Lauren Shou Family Trust
Purchase Details
Closed on
Apr 26, 2004
Sold by
Hui Kam Loi and Quach Jade N
Bought by
Shou Lauren Sut
Home Financials for this Owner
Home Financials are based on the most recent Mortgage that was taken out on this home.
Original Mortgage
$260,000
Interest Rate
5.35%
Mortgage Type
Purchase Money Mortgage
Purchase Details
Closed on
Sep 16, 1998
Sold by
Federal Home Loan Mortgage Corporation
Bought by
Hui Lam Loi and Quach Jade N
Home Financials for this Owner
Home Financials are based on the most recent Mortgage that was taken out on this home.
Original Mortgage
$68,000
Interest Rate
6.89%
Purchase Details
Closed on
Jun 5, 1997
Sold by
Hu Hing Chung and Hu Luk Sik
Bought by
Federal Home Loan Mortgage Corporation
Purchase Details
Closed on
Aug 30, 1996
Sold by
Hu Chi M
Bought by
Hu Luk Sik and Hu Oi Chau
Purchase Details
Closed on
Nov 10, 1994
Sold by
Hu King Sen
Bought by
Hu Chi Man
Purchase Details
Closed on
Oct 14, 1994
Sold by
Hu Hing Chung and Hu Luk Sik
Bought by
Hu King Sen
Create a Home Valuation Report for This Property
The Home Valuation Report is an in-depth analysis detailing your home's value as well as a comparison with similar homes in the area
Home Values in the Area
Average Home Value in this Area
Purchase History
| Date | Buyer | Sale Price | Title Company |
|---|---|---|---|
| Yeung Gody Wai Ming | -- | None Available | |
| Yeung Gody Wai Ming | $212,500 | Chicago Title Company | |
| Shou Lauren Sut | -- | None Available | |
| Shou Lauren Sut | $460,000 | First American Title Company | |
| Hui Lam Loi | $85,000 | North American Title Co | |
| Federal Home Loan Mortgage Corporation | $94,500 | -- | |
| Hu Luk Sik | -- | -- | |
| Hu Chi Man | -- | -- | |
| Hu King Sen | -- | -- |
Source: Public Records
Mortgage History
| Date | Status | Borrower | Loan Amount |
|---|---|---|---|
| Open | Yeung Gody Wai Ming | $150,000 | |
| Previous Owner | Shou Lauren Sut | $260,000 | |
| Previous Owner | Hui Lam Loi | $68,000 |
Source: Public Records
Tax History
| Year | Tax Paid | Tax Assessment Tax Assessment Total Assessment is a certain percentage of the fair market value that is determined by local assessors to be the total taxable value of land and additions on the property. | Land | Improvement |
|---|---|---|---|---|
| 2025 | $5,588 | $261,667 | $78,469 | $183,198 |
| 2024 | $5,588 | $256,538 | $76,931 | $179,607 |
| 2023 | $5,737 | $251,507 | $75,422 | $176,085 |
| 2022 | $5,463 | $246,578 | $73,944 | $172,634 |
| 2021 | $5,046 | $241,743 | $72,494 | $169,249 |
| 2020 | $4,987 | $239,265 | $71,751 | $167,514 |
| 2019 | $4,686 | $234,576 | $70,345 | $164,231 |
| 2018 | $4,592 | $229,977 | $68,966 | $161,011 |
| 2017 | $4,371 | $225,468 | $67,614 | $157,854 |
| 2016 | $4,168 | $221,048 | $66,288 | $154,760 |
| 2015 | $4,142 | $217,729 | $65,293 | $152,436 |
| 2014 | $4,201 | $213,464 | $64,014 | $149,450 |
Source: Public Records
Map
Nearby Homes
- 2322 E 21st St
- 2222 Inyo Ave
- 2304 E 22nd St
- 2555 Foothill Blvd
- 1757 26th Ave
- 2618 E 20th St
- 2624 Foothill Blvd
- 2017 27th Ave
- 2207 E 21st St
- 2004 27th Ave
- 2540 E 16th St Unit 2
- 2021 Mitchell St
- 1545 23rd Ave
- 1547 23rd Ave
- 2217 E 24th St
- 2724 E 22nd St
- 2216 E 23rd St
- 1526 Munson Way
- 2443 24th Ave
- 2036 E 20th St
Your Personal Tour Guide
Ask me questions while you tour the home.