
Seller's Agent in 2025
Hillary Mills
Fathom Realty
(336) 552-2842
2 in this area
74 Total Sales
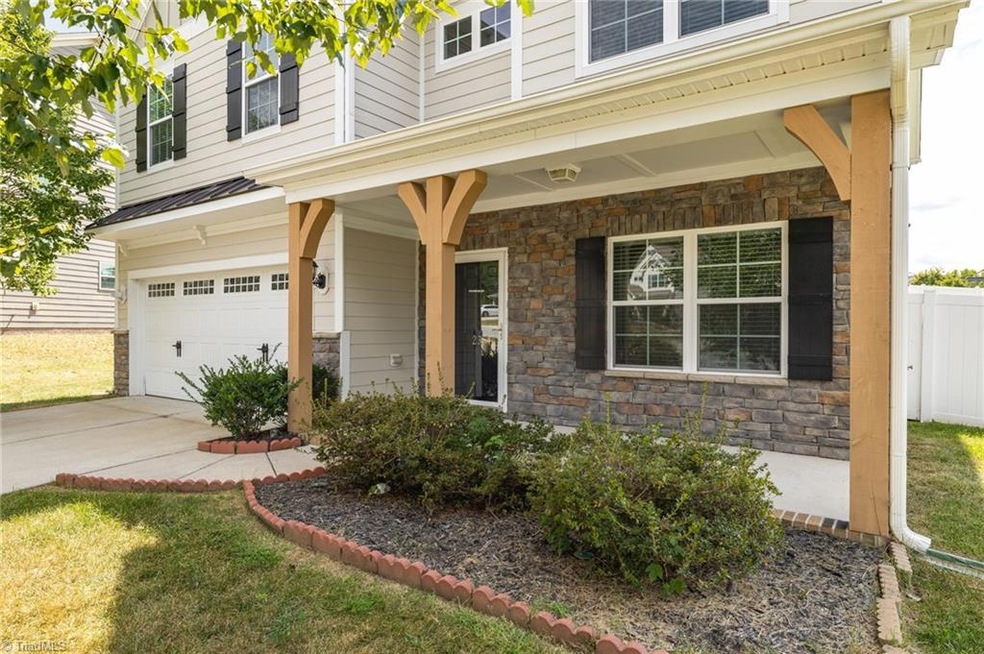
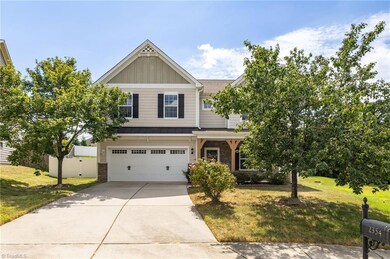
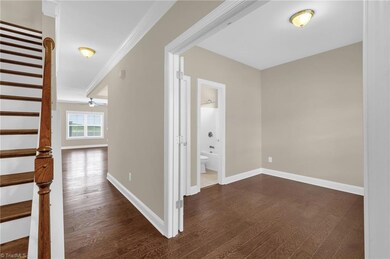
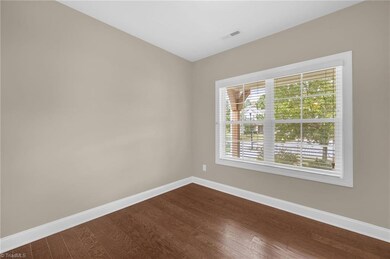
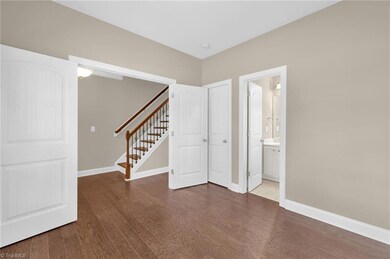
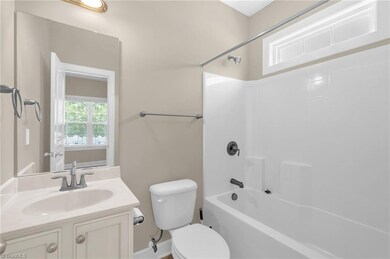
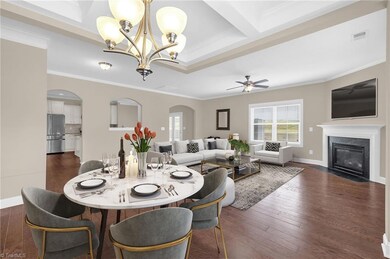
**$5k BUYER CREDIT IF UNDER CONTRACT BY END OF OCTOBER** Welcome to this stunning 6-bedroom, 3.5-bath home in High Point, NC! Step inside and be greeted by gorgeous new wood flooring that flows seamlessly throughout the first floor. The heart of the home is the modern kitchen, featuring brand new stainless steel appliances, a spacious island, and plenty of cabinet space—perfect for entertaining or family gatherings. This home offers incredible flexibility with a bedroom and ensuite bath conveniently located on the first floor. Upstairs, you’ll find a huge primary suite with a private sitting area, ideal for relaxing after a long day. Outside, enjoy your very own backyard retreat! A covered patio with ceiling fans overlooks the beautifully fenced-in yard, giving you the perfect spot for summer evenings and weekend cookouts. Also a neighborhood pool included in HOA! With space, style, and comfort throughout, this home checks all the boxes—don’t miss your chance to make it yours!
| Date | Type | Sale Price | Title Company |
|---|---|---|---|
| Warranty Deed | $470,000 | Integrated Title Services Llc | |
| Warranty Deed | $270,000 | None Available | |
| Special Warranty Deed | $250,500 | None Available | |
| Deed | -- | -- |
| Date | Status | Loan Amount | Loan Type |
|---|---|---|---|
| Open | $470,000 | VA | |
| Previous Owner | $256,500 | New Conventional | |
| Previous Owner | $237,680 | New Conventional |
| Date | Event | Price | List to Sale | Price per Sq Ft |
|---|---|---|---|---|
| 11/21/2025 11/21/25 | Sold | $470,000 | 0.0% | $149 / Sq Ft |
| 10/23/2025 10/23/25 | Pending | -- | -- | -- |
| 09/22/2025 09/22/25 | Price Changed | $470,000 | -1.9% | $149 / Sq Ft |
| 09/05/2025 09/05/25 | For Sale | $479,000 | -- | $152 / Sq Ft |
| Year | Tax Paid | Tax Assessment Tax Assessment Total Assessment is a certain percentage of the fair market value that is determined by local assessors to be the total taxable value of land and additions on the property. | Land | Improvement |
|---|---|---|---|---|
| 2025 | $4,248 | $308,300 | $54,000 | $254,300 |
| 2024 | $4,248 | $308,300 | $54,000 | $254,300 |
| 2023 | $4,248 | $308,300 | $54,000 | $254,300 |
| 2022 | $4,156 | $308,300 | $54,000 | $254,300 |
| 2021 | $3,354 | $243,400 | $48,000 | $195,400 |
| 2020 | $3,354 | $243,400 | $48,000 | $195,400 |
| 2019 | $3,354 | $243,400 | $0 | $0 |
| 2018 | $3,337 | $243,400 | $0 | $0 |
| 2017 | $3,337 | $243,400 | $0 | $0 |
| 2016 | $3,209 | $228,800 | $0 | $0 |
| 2015 | $3,226 | $228,800 | $0 | $0 |
| 2014 | $2,998 | $209,100 | $0 | $0 |
Seller's Agent in 2025
Hillary Mills
Fathom Realty
(336) 552-2842
2 in this area
74 Total Sales
Buyer's Agent in 2025
Katrina Lane
The Buyer Agency, LLC
(336) 456-4164
1 in this area
18 Total Sales
Source: Triad MLS
MLS Number: 1194633
APN: 0219913
Disclaimer: Certain information contained herein is derived from information provided by parties other than Homes.com. All information provided is deemed reliable, but is not guaranteed to be accurate and should be independently verified.
![]() Copyright 2026 Triad MLS, Inc. All rights reserved. IDX information is provided exclusively for personal, non-commercial use, and may not be used for any purpose other than to identify prospective properties consumers may be interested in purchasing. Information is deemed reliable but not guaranteed. This site will be monitored for ‘scraping’ and any use of search facilities of data on the site other than by potential buyers/sellers is prohibited. All Sale data is for informational purposes only and is not an indication of a market analysis or appraisal. Properties marked with the Triad MLS, Inc. icon are provided courtesy of the Triad MLS, Inc.’s, Internet Data Exchange Database.
Copyright 2026 Triad MLS, Inc. All rights reserved. IDX information is provided exclusively for personal, non-commercial use, and may not be used for any purpose other than to identify prospective properties consumers may be interested in purchasing. Information is deemed reliable but not guaranteed. This site will be monitored for ‘scraping’ and any use of search facilities of data on the site other than by potential buyers/sellers is prohibited. All Sale data is for informational purposes only and is not an indication of a market analysis or appraisal. Properties marked with the Triad MLS, Inc. icon are provided courtesy of the Triad MLS, Inc.’s, Internet Data Exchange Database.
Ask me questions while you tour the home.