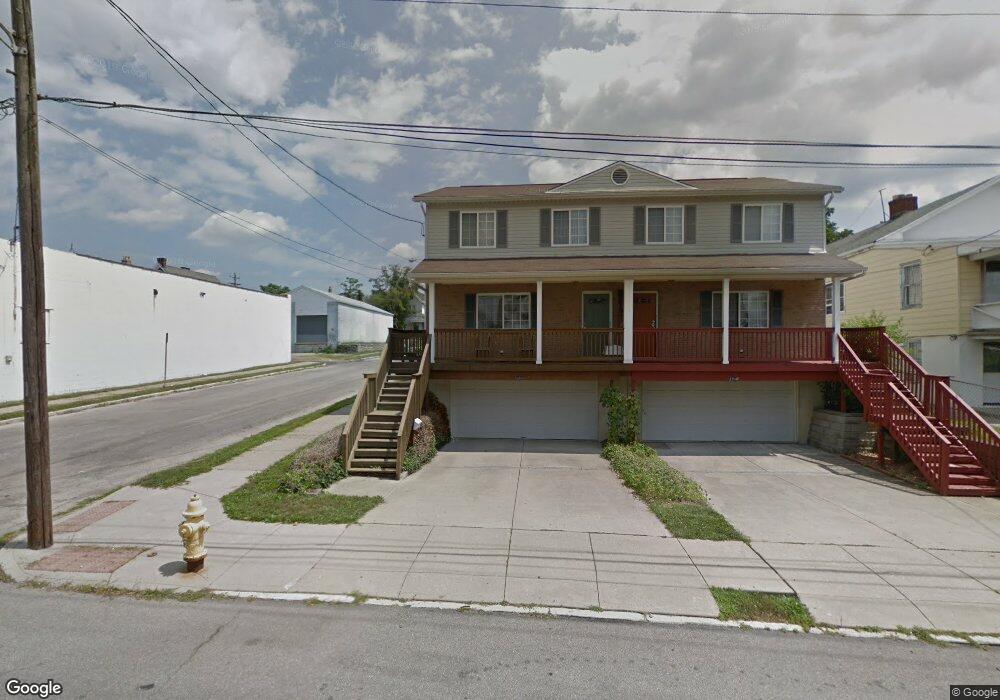
2354 May St Cincinnati, OH 45206
Walnut Hills NeighborhoodEstimated Value: $243,000 - $300,000
3
Beds
3
Baths
1,512
Sq Ft
$180/Sq Ft
Est. Value
About This Home
This home is located at 2354 May St, Cincinnati, OH 45206 and is currently estimated at $271,796, approximately $179 per square foot. 2354 May St is a home located in Hamilton County with nearby schools including Frederick Douglass Elementary School, Robert A. Taft Information Technology High School, and Clark Montessori High School.
Ownership History
Date
Name
Owned For
Owner Type
Purchase Details
Closed on
Dec 20, 2021
Sold by
630 Burbank Llc
Bought by
Cincinnati Capital Partners 482 Llc
Current Estimated Value
Purchase Details
Closed on
Jul 10, 1997
Sold by
Jireh Development Corp Inc
Bought by
Thomas Samuel L
Home Financials for this Owner
Home Financials are based on the most recent Mortgage that was taken out on this home.
Original Mortgage
$60,000
Interest Rate
7.54%
Purchase Details
Closed on
Feb 19, 1997
Sold by
Jireh Development Corp Inc
Bought by
Vanpelt Nancy
Home Financials for this Owner
Home Financials are based on the most recent Mortgage that was taken out on this home.
Original Mortgage
$50,000
Interest Rate
7.44%
Create a Home Valuation Report for This Property
The Home Valuation Report is an in-depth analysis detailing your home's value as well as a comparison with similar homes in the area
Home Values in the Area
Average Home Value in this Area
Purchase History
| Date | Buyer | Sale Price | Title Company |
|---|---|---|---|
| Cincinnati Capital Partners 482 Llc | -- | None Available | |
| Thomas Samuel L | $75,000 | -- | |
| Vanpelt Nancy | $75,000 | -- |
Source: Public Records
Mortgage History
| Date | Status | Borrower | Loan Amount |
|---|---|---|---|
| Previous Owner | Thomas Samuel L | $60,000 | |
| Previous Owner | Vanpelt Nancy | $50,000 |
Source: Public Records
Tax History
| Year | Tax Paid | Tax Assessment Tax Assessment Total Assessment is a certain percentage of the fair market value that is determined by local assessors to be the total taxable value of land and additions on the property. | Land | Improvement |
|---|---|---|---|---|
| 2025 | $2,981 | $58,471 | $3,584 | $54,887 |
| 2024 | $2,894 | $58,471 | $3,584 | $54,887 |
| 2023 | $3,011 | $58,471 | $3,584 | $54,887 |
| 2022 | $2,313 | $42,679 | $2,149 | $40,530 |
| 2021 | $2,211 | $42,679 | $2,149 | $40,530 |
| 2020 | $2,292 | $42,679 | $2,149 | $40,530 |
| 2019 | $1,977 | $35,567 | $1,792 | $33,775 |
| 2018 | $1,981 | $35,567 | $1,792 | $33,775 |
| 2017 | $1,873 | $35,567 | $1,792 | $33,775 |
| 2016 | $2,293 | $41,203 | $1,796 | $39,407 |
| 2015 | $2,075 | $41,203 | $1,796 | $39,407 |
| 2014 | $2,028 | $41,203 | $1,796 | $39,407 |
| 2013 | $2,181 | $42,043 | $1,831 | $40,212 |
Source: Public Records
Map
Nearby Homes
- 2406 Kenton St
- 2410 Kenton St
- 2407 Concord St
- 2363 Concord St
- 2361 Concord St
- 709 E Mcmillan St
- 2309 Kenton St
- 2528 Hemlock St
- 2226 Kenton St
- 911 Rogers Place
- 668 June St
- 610 Crown St
- 2427 Dover St
- 2604 Melrose Ave
- 965 Windsor St
- 967 Windsor St
- 2334 Kemper Ln
- 915 Sharkey Ln Unit 8
- 964 Auburnview Dr
- 2232 Kemper Ln
Your Personal Tour Guide
Ask me questions while you tour the home.