Estimated Value: $553,000 - $583,000
6
Beds
3
Baths
3,050
Sq Ft
$185/Sq Ft
Est. Value
About This Home
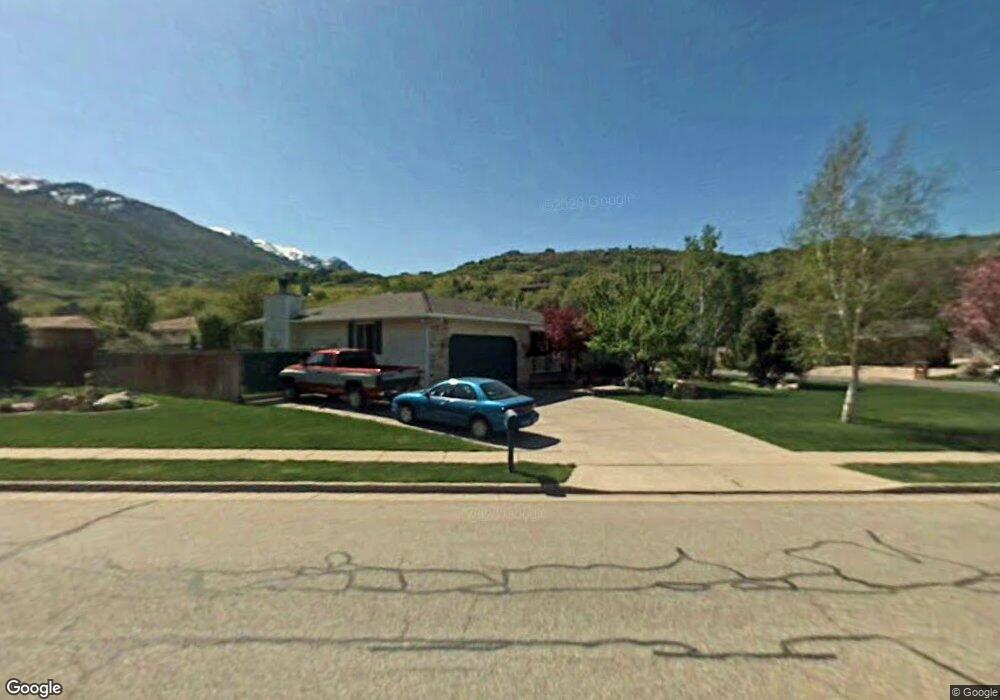
This home is located at 2355 Deer Run Dr, Ogden, UT 84405 and is currently estimated at $563,718, approximately $184 per square foot. 2355 Deer Run Dr is a home located in Davis County with nearby schools including South Weber Elementary School, Sunset Junior High School, and Northridge High School.
Ownership History
Date
Name
Owned For
Owner Type
Purchase Details
Closed on
Nov 29, 2019
Sold by
Blowers David A and Blowers Becky H
Bought by
Blowers Eric and Blowers Kelsey
Current Estimated Value
Home Financials for this Owner
Home Financials are based on the most recent Mortgage that was taken out on this home.
Original Mortgage
$320,817
Outstanding Balance
$283,074
Interest Rate
3.75%
Mortgage Type
FHA
Estimated Equity
$280,644
Purchase Details
Closed on
Aug 17, 2000
Sold by
Tms Mtg Corp
Bought by
Blowers David A and Blowers Becky H
Home Financials for this Owner
Home Financials are based on the most recent Mortgage that was taken out on this home.
Original Mortgage
$152,000
Interest Rate
8.2%
Purchase Details
Closed on
Jan 13, 2000
Sold by
Seeley Carleton J
Bought by
Tms Mtg Corp
Create a Home Valuation Report for This Property
The Home Valuation Report is an in-depth analysis detailing your home's value as well as a comparison with similar homes in the area
Home Values in the Area
Average Home Value in this Area
Purchase History
| Date | Buyer | Sale Price | Title Company |
|---|---|---|---|
| Blowers Eric | -- | Advanced Title Ins A | |
| Blowers David A | -- | First American Title Co | |
| Tms Mtg Corp | $174,927 | Backman Stewart Title Servic |
Source: Public Records
Mortgage History
| Date | Status | Borrower | Loan Amount |
|---|---|---|---|
| Open | Blowers Eric | $320,817 | |
| Previous Owner | Blowers David A | $152,000 |
Source: Public Records
Tax History Compared to Growth
Tax History
| Year | Tax Paid | Tax Assessment Tax Assessment Total Assessment is a certain percentage of the fair market value that is determined by local assessors to be the total taxable value of land and additions on the property. | Land | Improvement |
|---|---|---|---|---|
| 2025 | $3,063 | $280,500 | $126,009 | $154,491 |
| 2024 | $3,063 | $265,100 | $104,100 | $161,000 |
| 2023 | $2,955 | $465,000 | $167,865 | $297,135 |
| 2022 | $3,172 | $279,950 | $88,532 | $191,418 |
| 2021 | $2,863 | $382,000 | $129,928 | $252,072 |
| 2020 | $2,599 | $335,000 | $120,125 | $214,875 |
| 2019 | $2,559 | $325,000 | $112,785 | $212,215 |
| 2018 | $2,253 | $298,000 | $102,354 | $195,646 |
| 2016 | $2,035 | $144,705 | $44,131 | $100,574 |
| 2015 | $1,956 | $131,340 | $44,131 | $87,209 |
| 2014 | $1,859 | $126,636 | $50,725 | $75,911 |
| 2013 | -- | $106,674 | $37,109 | $69,565 |
Source: Public Records
Map
Nearby Homes
- 8149 S 2425 E
- 2368 E 8300 S
- 2256 E 8240 S
- 8089 S 2475 E
- 8065 S 2525 E
- 8007 S 2550 E
- 3778 N 2675 E
- 2387 E 7925 S
- 3785 N 2675 E
- 2283 E 7925 S
- 7941 S 2250 E
- 8230 S 2650 E Unit 28
- 3680 N 2300 E
- 2681 E Sunshine Ct
- 2660 E 3700 N
- 8129 S Cedar Circle Cir E
- 3624 N 2775 E
- 3606 N 2775 E
- 2002 E Deer Run Dr Run
- 2820 E 3600 N
- 2371 Deer Run Dr
- 8098 S 2350 E
- 8099 S 2350 E
- 8105 S 2350 E
- 2348 Deer Run Dr
- 2360 Deer Run Dr
- 2666 Deer Run Dr
- 2338 Deer Run Dr
- 8107 S 2350 E
- 2376 Deer Run Dr
- 2385 Deer Run Dr
- 2328 Deer Run Dr
- 8102 S 2350 E
- 8102 S 2350 E Unit 37
- 8136 Deer Run Way
- 8142 Deer Run Way
- 8111 S 2350 E
- 8130 Deer Run Way
- 8146 Deer Run Way
- 8118 Deer Run Way