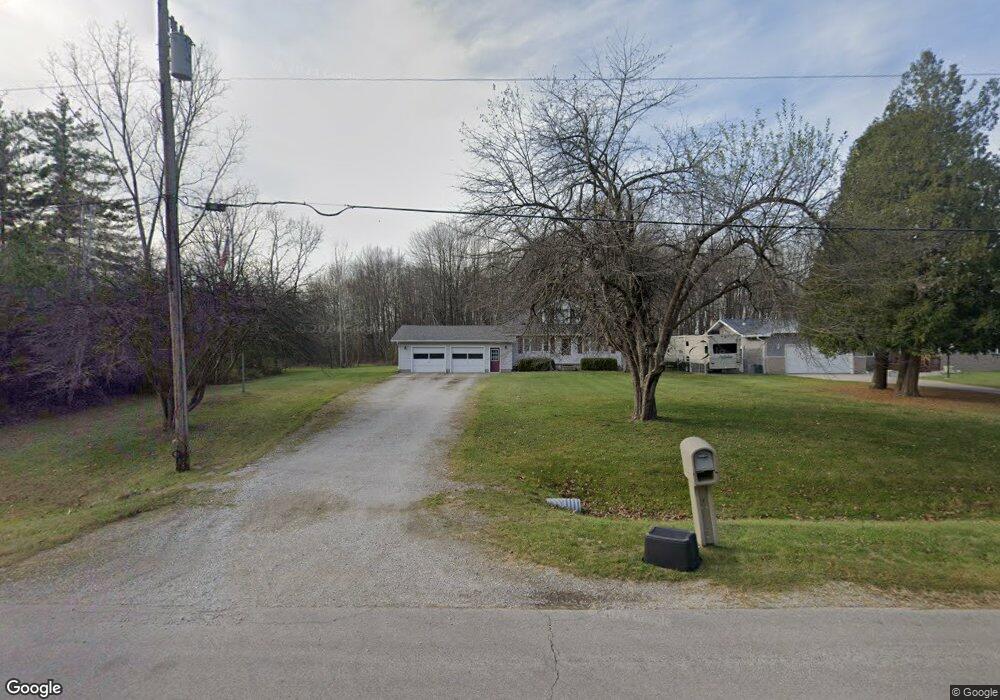
2355 Hueling Rd Port Huron, MI 48060
Estimated Value: $206,000 - $228,000
4
Beds
1
Bath
1,558
Sq Ft
$137/Sq Ft
Est. Value
About This Home
This home is located at 2355 Hueling Rd, Port Huron, MI 48060 and is currently estimated at $213,784, approximately $137 per square foot. 2355 Hueling Rd is a home located in St. Clair County with nearby schools including Indian Woods Elementary School, Central Middle School, and Port Huron High School.
Ownership History
Date
Name
Owned For
Owner Type
Purchase Details
Closed on
Dec 27, 2023
Sold by
Lee Glenn W
Bought by
Glenn W Lee Revocable Trust and Lee
Current Estimated Value
Purchase Details
Closed on
Feb 2, 2009
Sold by
Federal National Mortgage Association
Bought by
Lee Glenn
Purchase Details
Closed on
Jan 24, 2008
Sold by
Mortgage Electric Registration System In
Bought by
Federal National Mortgage Association
Purchase Details
Closed on
Jan 17, 2008
Sold by
Forro Louise M and Forro Michael
Bought by
Mortgage Electronic Registration Systems
Purchase Details
Closed on
Jan 3, 2008
Sold by
Forro Michael and Forro Lousie
Bought by
Forro Louise
Create a Home Valuation Report for This Property
The Home Valuation Report is an in-depth analysis detailing your home's value as well as a comparison with similar homes in the area
Home Values in the Area
Average Home Value in this Area
Purchase History
| Date | Buyer | Sale Price | Title Company |
|---|---|---|---|
| Glenn W Lee Revocable Trust | -- | None Listed On Document | |
| Lee Glenn | $89,900 | Warranty Title Agency Llc | |
| Federal National Mortgage Association | -- | None Available | |
| Mortgage Electronic Registration Systems | $136,700 | None Available | |
| Forro Louise | -- | None Available |
Source: Public Records
Tax History Compared to Growth
Tax History
| Year | Tax Paid | Tax Assessment Tax Assessment Total Assessment is a certain percentage of the fair market value that is determined by local assessors to be the total taxable value of land and additions on the property. | Land | Improvement |
|---|---|---|---|---|
| 2025 | $1,583 | $73,800 | $0 | $0 |
| 2024 | $831 | $76,800 | $0 | $0 |
| 2023 | $767 | $71,300 | $0 | $0 |
| 2022 | $1,417 | $58,500 | $0 | $0 |
| 2021 | $1,312 | $47,200 | $0 | $0 |
| 2020 | $1,312 | $47,300 | $47,300 | $0 |
| 2019 | $1,274 | $44,000 | $0 | $0 |
| 2018 | $1,244 | $44,000 | $0 | $0 |
| 2017 | $1,251 | $38,400 | $0 | $0 |
| 2016 | $630 | $38,400 | $0 | $0 |
| 2015 | -- | $37,700 | $37,700 | $0 |
| 2014 | -- | $35,500 | $35,500 | $0 |
| 2013 | -- | $34,900 | $0 | $0 |
Source: Public Records
Map
Nearby Homes
- 4380 Lapeer Rd
- 0 Wall Rd Unit 50185999
- 0000 Range Rd
- 4595 Griswold Rd
- 0 Lapeer Rd Unit 50137357
- 00 Howard Rd
- 2863 Beach Rd
- 4632 Cloverdale Ln
- 0 Allen Rd Unit 20250008597
- 0 Allen Rd Unit 20250008612
- 4911 Castlewood Dr
- 1830 Leland Rd
- 1405 Range Rd
- 1979 Allen Rd
- 4608 Huntington Dr
- 3152 Spruce Dr
- 0000 W Water St
- 3115 Spruce Dr
- 2566 Lewis Dr
- 00 Range Rd
- 2365 Hueling Rd
- 2389 Hueling Rd
- 2380 Hueling Rd
- 2325 Hueling Rd
- 2403 Hueling Rd
- 2400 Hueling Rd
- 2360 Hueling Rd
- 2328 Hueling Rd
- 2318 Hueling Rd
- 2419 Hueling Rd
- 2408 Hueling Rd
- 2265 Hueling Rd
- 2268 Hueling Rd
- 2426 Hueling Rd
- 4364 Howard Rd
- 2260 Hueling Rd
- 2442 Hueling Rd
- 4372 Howard Rd
- 2255 Hueling Rd
- Range Rd