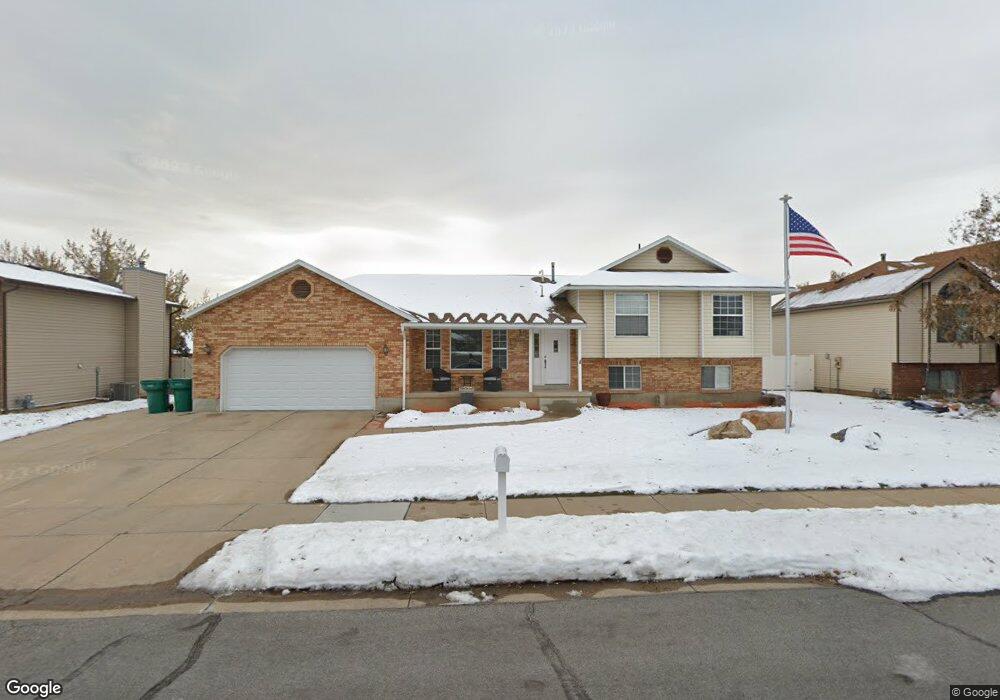
2355 N 2275 E Layton, UT 84040
Estimated Value: $521,000 - $565,000
5
Beds
3
Baths
1,378
Sq Ft
$396/Sq Ft
Est. Value
About This Home
This home is located at 2355 N 2275 E, Layton, UT 84040 and is currently estimated at $546,017, approximately $396 per square foot. 2355 N 2275 E is a home located in Davis County with nearby schools including Sarah Jane Adams Elementary School, North Layton Junior High School, and Northridge High School.
Ownership History
Date
Name
Owned For
Owner Type
Purchase Details
Closed on
Mar 25, 2021
Sold by
Cook Annette and Cook Gary F
Bought by
Cook Mary Annette and Cook Gary F
Current Estimated Value
Purchase Details
Closed on
Feb 22, 2010
Sold by
Cook Gary F and Cook Annette
Bought by
Cook Annette and Cook Gary F
Home Financials for this Owner
Home Financials are based on the most recent Mortgage that was taken out on this home.
Original Mortgage
$120,065
Interest Rate
5.25%
Mortgage Type
FHA
Create a Home Valuation Report for This Property
The Home Valuation Report is an in-depth analysis detailing your home's value as well as a comparison with similar homes in the area
Home Values in the Area
Average Home Value in this Area
Purchase History
| Date | Buyer | Sale Price | Title Company |
|---|---|---|---|
| Cook Mary Annette | -- | Timios Inc | |
| Cook Annette | -- | Keystone Title Ins Agency |
Source: Public Records
Mortgage History
| Date | Status | Borrower | Loan Amount |
|---|---|---|---|
| Closed | Cook Annette | $120,065 |
Source: Public Records
Tax History
| Year | Tax Paid | Tax Assessment Tax Assessment Total Assessment is a certain percentage of the fair market value that is determined by local assessors to be the total taxable value of land and additions on the property. | Land | Improvement |
|---|---|---|---|---|
| 2025 | $2,845 | $279,400 | $123,792 | $155,608 |
| 2024 | $2,705 | $268,950 | $147,746 | $121,204 |
| 2023 | $2,651 | $468,000 | $199,490 | $268,510 |
| 2022 | $2,792 | $269,500 | $106,981 | $162,519 |
| 2021 | $2,519 | $362,000 | $162,775 | $199,225 |
| 2020 | $2,294 | $316,000 | $131,643 | $184,357 |
| 2019 | $2,233 | $303,000 | $117,631 | $185,369 |
| 2018 | $2,032 | $277,000 | $91,447 | $185,553 |
| 2016 | $1,849 | $131,670 | $48,158 | $83,512 |
| 2015 | $1,791 | $121,495 | $48,158 | $73,337 |
| 2014 | $1,713 | $119,194 | $48,158 | $71,036 |
| 2013 | -- | $106,638 | $25,032 | $81,606 |
Source: Public Records
Map
Nearby Homes
- 2340 N 2050 E
- 2597 N 2300 E
- 2273 N 1975 E
- 2563 E 2250 N
- 1907 N Bridge Ct
- 2189 N 1950 E
- 2509 E 1900 N
- 2547 E 1900 N
- 1954 N 2600 E
- 2136 N 2800 E
- 2391 Kays Creek Dr
- 2353 Canyon View Dr
- 3142 E Thorley Dr
- 3138 E Thorley Dr
- 1935 Deere Valley Dr
- 1911 Deere Valley Dr
- 2569 N 2900 E
- 1785 E 2825 N
- 1843 Hayes Dr
- 1731 E 2825 N
Your Personal Tour Guide
Ask me questions while you tour the home.