2355 N Bubb Way Inverness, FL 34453
Estimated Value: $157,000 - $228,000
2
Beds
1
Bath
1,215
Sq Ft
$165/Sq Ft
Est. Value
About This Home
This home is located at 2355 N Bubb Way, Inverness, FL 34453 and is currently estimated at $200,889, approximately $165 per square foot. 2355 N Bubb Way is a home located in Citrus County with nearby schools including Hernando Elementary School, Inverness Middle School, and Citrus High School.
Ownership History
Date
Name
Owned For
Owner Type
Purchase Details
Closed on
Feb 28, 2018
Sold by
Dcon Properties Llc
Bought by
Gonzales Jessica
Current Estimated Value
Home Financials for this Owner
Home Financials are based on the most recent Mortgage that was taken out on this home.
Original Mortgage
$71,579
Outstanding Balance
$61,147
Interest Rate
4.25%
Mortgage Type
FHA
Estimated Equity
$139,742
Purchase Details
Closed on
Apr 21, 2015
Sold by
Jma Development Inc
Bought by
Dcon Properties Llc
Purchase Details
Closed on
Jun 16, 2009
Sold by
Jma Development Inc
Bought by
Jma Development Llc
Purchase Details
Closed on
Jun 1, 2009
Bought by
Dcon Properties Llc
Purchase Details
Closed on
Aug 1, 1990
Bought by
Dcon Properties Llc
Purchase Details
Closed on
Apr 1, 1990
Bought by
Dcon Properties Llc
Purchase Details
Closed on
Nov 1, 1985
Bought by
Dcon Properties Llc
Create a Home Valuation Report for This Property
The Home Valuation Report is an in-depth analysis detailing your home's value as well as a comparison with similar homes in the area
Home Values in the Area
Average Home Value in this Area
Purchase History
| Date | Buyer | Sale Price | Title Company |
|---|---|---|---|
| Gonzales Jessica | $72,900 | Attorney | |
| Dcon Properties Llc | -- | None Available | |
| Jma Development Llc | -- | Attorney | |
| Dcon Properties Llc | $100 | -- | |
| Dcon Properties Llc | $100 | -- | |
| Dcon Properties Llc | $100 | -- | |
| Dcon Properties Llc | $68,000 | -- |
Source: Public Records
Mortgage History
| Date | Status | Borrower | Loan Amount |
|---|---|---|---|
| Open | Gonzales Jessica | $71,579 |
Source: Public Records
Tax History Compared to Growth
Tax History
| Year | Tax Paid | Tax Assessment Tax Assessment Total Assessment is a certain percentage of the fair market value that is determined by local assessors to be the total taxable value of land and additions on the property. | Land | Improvement |
|---|---|---|---|---|
| 2024 | $1,488 | $133,138 | -- | -- |
| 2023 | $1,488 | $129,260 | $0 | $0 |
| 2022 | $1,392 | $125,495 | $0 | $0 |
| 2021 | $1,335 | $121,840 | $27,990 | $93,850 |
| 2020 | $1,740 | $112,810 | $27,990 | $84,820 |
| 2019 | $1,611 | $102,230 | $26,660 | $75,570 |
| 2018 | $1,364 | $85,200 | $26,660 | $58,540 |
| 2017 | $1,317 | $80,250 | $26,660 | $53,590 |
| 2016 | $1,304 | $76,430 | $26,660 | $49,770 |
| 2015 | $1,231 | $70,321 | $26,890 | $43,431 |
| 2014 | -- | $70,620 | $30,043 | $40,577 |
Source: Public Records
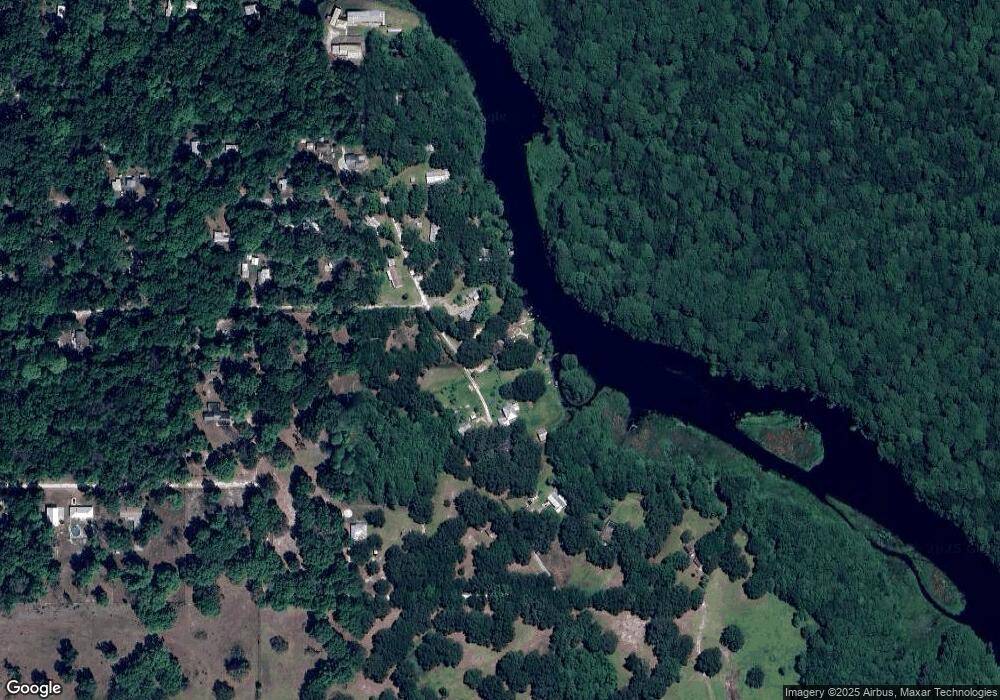
Map
Nearby Homes
- 9368 E Riveroak Ln
- 2400 N Junglecamp Rd
- 2424 N Junglecamp Rd
- 9379 E Tin Pan Alley
- 9339 E Tin Pan Alley
- 2452 N Junglecamp
- 2452 N Junglecamp Unit LotWP001
- 2732 N Junglecamp Rd
- 2798 N Junglecamp Rd
- 9360 E Briar Ct
- 9249 E River Moon Ct
- 8700 E Matthew Meadow Ct
- 9215 E Roan Ln
- 1708 N Retreat Dr
- 7897 E Wooded Trail
- 2011 N Twig Point
- 7850 E Wooded Trail
- 7966 E Leaf Ct
- 8109 E Tierra Ct
- 9028 & 9034 E Island Dr
- 2367 N Bubb Way
- 2359 Bubb Way
- 2301 N Bayou Point
- 2401 N Bubb Way
- 2400 N Bubb Way
- 2277 N Bayou Point
- 2406 N Junglecamp Rd
- 2403 N Junglecamp Rd
- 9679 E Newman Dr
- 2409 N Junglecamp Rd
- 9465 E Riveroak Ln
- 9525 E Newman Dr
- 2411 N Junglecamp Rd
- 9493 E Newman Dr
- 2413 N Junglecamp Rd
- 9481 E Tin Pan Alley
- 9741 E Newman Dr
- 9435 E Newman Dr
- 2421 N Junglecamp Rd
- 2415 N Junglecamp Rd