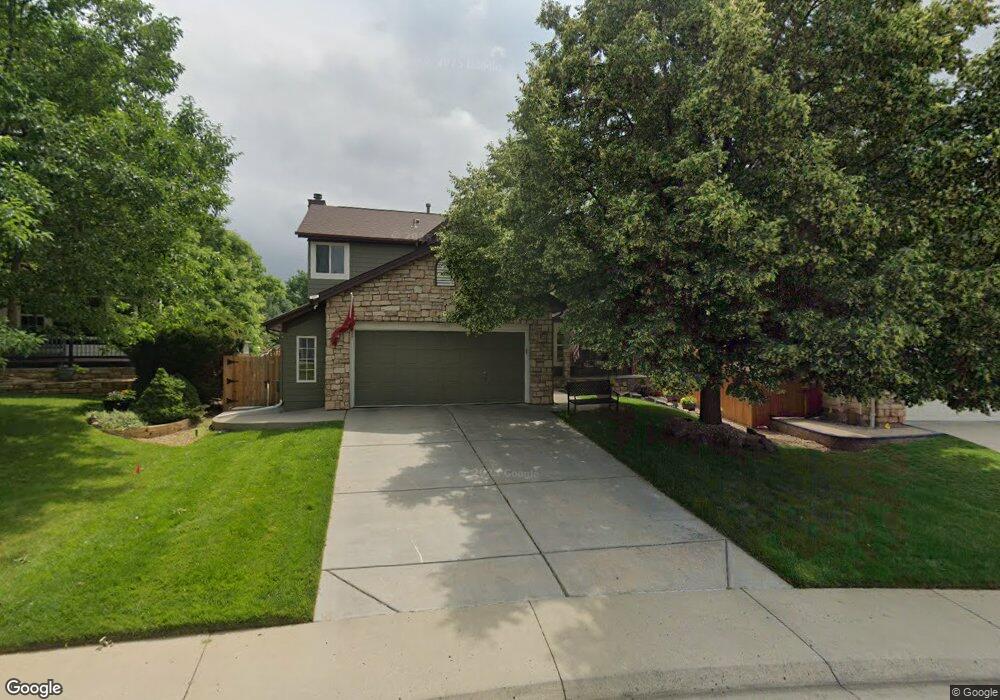
2355 S Holman Cir Lakewood, CO 80228
Green Mountain NeighborhoodEstimated Value: $847,000 - $964,000
4
Beds
5
Baths
2,476
Sq Ft
$355/Sq Ft
Est. Value
About This Home
This home is located at 2355 S Holman Cir, Lakewood, CO 80228 and is currently estimated at $879,882, approximately $355 per square foot. 2355 S Holman Cir is a home located in Jefferson County with nearby schools including Hutchinson Elementary School, Dunstan Middle School, and Green Mountain High School.
Ownership History
Date
Name
Owned For
Owner Type
Purchase Details
Closed on
Mar 25, 2002
Sold by
Conte Juan Jose
Bought by
Sark Thomas and Sark Cindy
Current Estimated Value
Home Financials for this Owner
Home Financials are based on the most recent Mortgage that was taken out on this home.
Original Mortgage
$241,500
Outstanding Balance
$98,892
Interest Rate
6.78%
Estimated Equity
$780,990
Purchase Details
Closed on
Aug 30, 1996
Sold by
Rush William C and Rush Lisa J
Bought by
Conte Juan Jose
Home Financials for this Owner
Home Financials are based on the most recent Mortgage that was taken out on this home.
Original Mortgage
$172,500
Interest Rate
9.9%
Purchase Details
Closed on
Oct 19, 1993
Sold by
Ryland Group Inc
Bought by
Rush William C and Rush Lisa J
Home Financials for this Owner
Home Financials are based on the most recent Mortgage that was taken out on this home.
Original Mortgage
$164,400
Interest Rate
6.87%
Create a Home Valuation Report for This Property
The Home Valuation Report is an in-depth analysis detailing your home's value as well as a comparison with similar homes in the area
Home Values in the Area
Average Home Value in this Area
Purchase History
| Date | Buyer | Sale Price | Title Company |
|---|---|---|---|
| Sark Thomas | $345,000 | Chicago Title Co | |
| Conte Juan Jose | $230,000 | -- | |
| Rush William C | $188,900 | -- |
Source: Public Records
Mortgage History
| Date | Status | Borrower | Loan Amount |
|---|---|---|---|
| Open | Sark Thomas | $241,500 | |
| Previous Owner | Conte Juan Jose | $172,500 | |
| Previous Owner | Rush William C | $164,400 |
Source: Public Records
Tax History Compared to Growth
Tax History
| Year | Tax Paid | Tax Assessment Tax Assessment Total Assessment is a certain percentage of the fair market value that is determined by local assessors to be the total taxable value of land and additions on the property. | Land | Improvement |
|---|---|---|---|---|
| 2024 | $4,521 | $50,125 | $16,978 | $33,147 |
| 2023 | $4,521 | $50,125 | $16,978 | $33,147 |
| 2022 | $3,795 | $41,140 | $13,288 | $27,852 |
| 2021 | $3,850 | $42,323 | $13,670 | $28,653 |
| 2020 | $3,488 | $38,513 | $11,909 | $26,604 |
| 2019 | $3,442 | $38,513 | $11,909 | $26,604 |
| 2018 | $3,140 | $33,978 | $9,085 | $24,893 |
| 2017 | $2,760 | $33,978 | $9,085 | $24,893 |
| 2016 | $3,075 | $35,320 | $9,148 | $26,172 |
| 2015 | $2,864 | $35,320 | $9,148 | $26,172 |
| 2014 | $2,864 | $30,143 | $6,136 | $24,007 |
Source: Public Records
Map
Nearby Homes
- 2332 S Fig St
- 2336 S Eldridge Ct
- 14976 W Warren Ave
- 15116 W Harvard Cir
- 13804 W Iliff Ave
- 2126 S Juniper St
- 13934 W Warren Dr
- 2347 S Loveland St
- 2385 S Loveland Way
- 2540 S Deframe St
- 14420 W Yale Place
- 2663 S Deframe Cir
- 14540 W Amherst Place
- 14630 W Amherst Place
- 2675 S Deframe Cir
- 2175 S Deframe St
- 15295 W Baker Ave
- 2164 S Nile St
- 2811 S Fig St
- 15274 W La Salle Ave
- 2357 S Holman Cir
- 2347 S Holman Cir
- 2345 S Holman Cir
- 2365 S Holman Cir
- 2334 S Holman Cir
- 14485 W Iliff Ave
- 2337 S Holman Cir
- 2367 S Holman Cir
- 14293 W Baltic Ave
- 2364 S Holman Cir
- 14283 W Baltic Ave
- 2326 S Holman Cir
- 14475 W Iliff Ave
- 2366 S Holman Cir
- 2335 S Holman Cir
- 2375 S Holman Cir
- 14250 W Warren Dr
- 14486 W Iliff Ave
- 14273 W Baltic Ave
- 2374 S Holman Cir